Break-Out Trader Lite
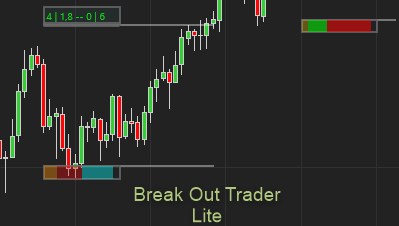
  1. Home
  2. /
  3. downloads
  4. /
  5. Break-Out Trader Lite

Break-Out Trader Lite

Introduction to Break-Out Trader Lite: A product developed for the Ninjatrader platform

In financial markets, price movements oscillate between two primary states: consolidation and expansion. These phases play a crucial role in determining market dynamics. These setups consistently produce great trade setups for the beginner as well as the experienced trader.

Consolidation (Accumulation): During consolidation, an asset’s price moves within a relatively narrow range. This phase reflects a temporary equilibrium between buyers and sellers. Traders often refer to it as the “accumulation” phase because market participants are gathering positions before the next significant move.

Breakout Opportunities: After a period of consolidation, the market tends to break out in one direction. A breakout occurs when the price escapes the range and establishes a new trend. These breakout moments present exciting opportunities for traders to capitalize on price momentum.

We have developed this powerful indicator called breakout trader to capitalize on these great trade setups!
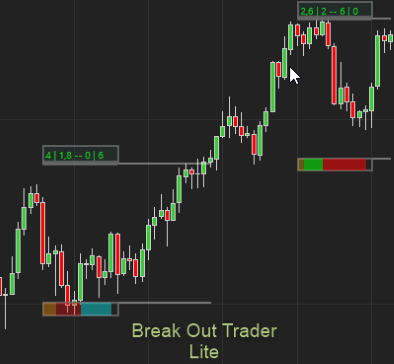
Break-Out Trader Lite

Our research has shown that when these consolidations adhere to a set of strict rules in terms of volatility, trend and volume they produce the best results. Our algorithm looks for consolidations and then qualify them based on a strict criteria.

For more information on Break-Out Trader Lite, please visit the page here: https://quaderr.com/break-out-trader/

MORE PRODUCTS YOU MAY LIKE

We pick out some of our products

Heat

Most of us use a bunch of indicators to tell us the states of the trend, momentum, volume, volatility and other variables. It can become quite daunting to figure out just what is really going on in the market. We can get many confusing signals by using all our indicators. We have created a model […]
$490.00

Q-Curve

Q-Curve is a trend following indicator that looks for reversals. We need a long consistent trend in the same direction to start. We then look for the reversion points to appear on the chart. These points indicate when the market is finding resistance after an extended trend. For more info, visit the page here: https://quaderr.com/q-curve/
$199.00

Break-Out Trader Pro

Introduction to Break-Out Trader Pro: A product developed for the Ninjatrader platform In financial markets, price movements oscillate between two primary states: consolidation and expansion. These phases play a crucial role in determining market dynamics. These setups consistently produce great trade setups for the beginner as well as the experienced trader. Consolidation (Accumulation): During consolidation, […]
$580.00

Neo Semi Automated

Neo Semi is a Trade Management Tool that tells you when to Buy and how many to Buy. It also tells you when to take Profits, Execute a Trailing Stoploss and when to apply a Maximum Stop Loss. Our Ninjatrader strategy zeroes in on “major” breakouts on the MES and MNQ futures contracts, those pivotal price […]
$499.00

Q TSL p

This Indicator uses our Q TSL indicator to plot a TSL level when you have a position. Whilst your account has no position it will only plot the initial stoploss levels along with the position size.  In other words it will keep your charts clean from clutter and only give you the required information when […]
$295.00
ADDED TO CART