We offer a diverse range of meticulously crafted Ninjatrader indicators designed to cater to every trader’s unique needs. Our products are showcased on this page with concise summaries, inviting you to explore further by clicking on individual links for more detailed information.
Our Newest Arrivals
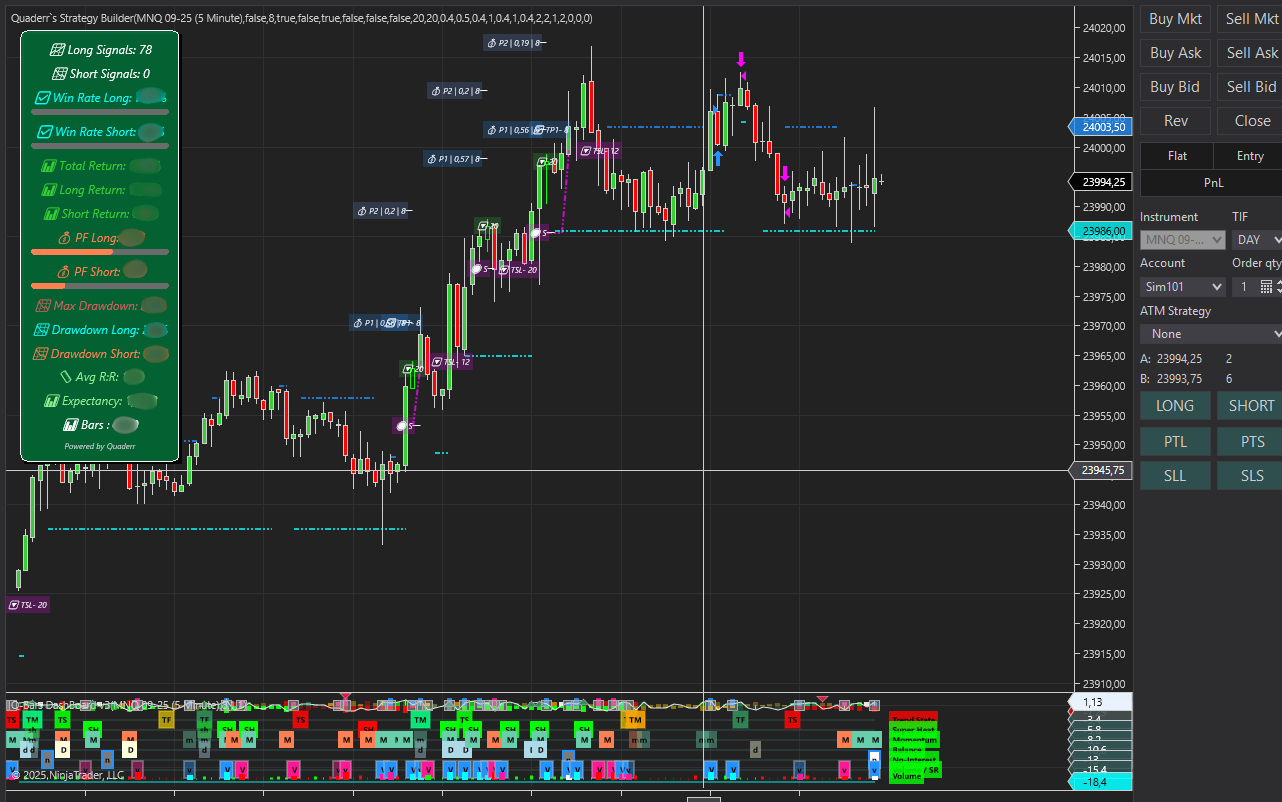
Quaderr Strategy Builder
No Code, Full Control The Quaderr Strategy Builder eliminates the need to write a single line of code. Traders can define complex logic, manage multi-exit strategies, and configure real-time analytics using an intuitive interface designed for precision and flexibility. By removing programming barriers, it shifts the focus from syntax to strategy—empowering users to concentrate on what matters most: decision-making, performance, and refinement.
Click the link below to watch a tutorial video and learn more about this great new tool.
CBO
Identify breakout zones early, manage risk with precision, and trade with confidence.
Click the link below to learn more.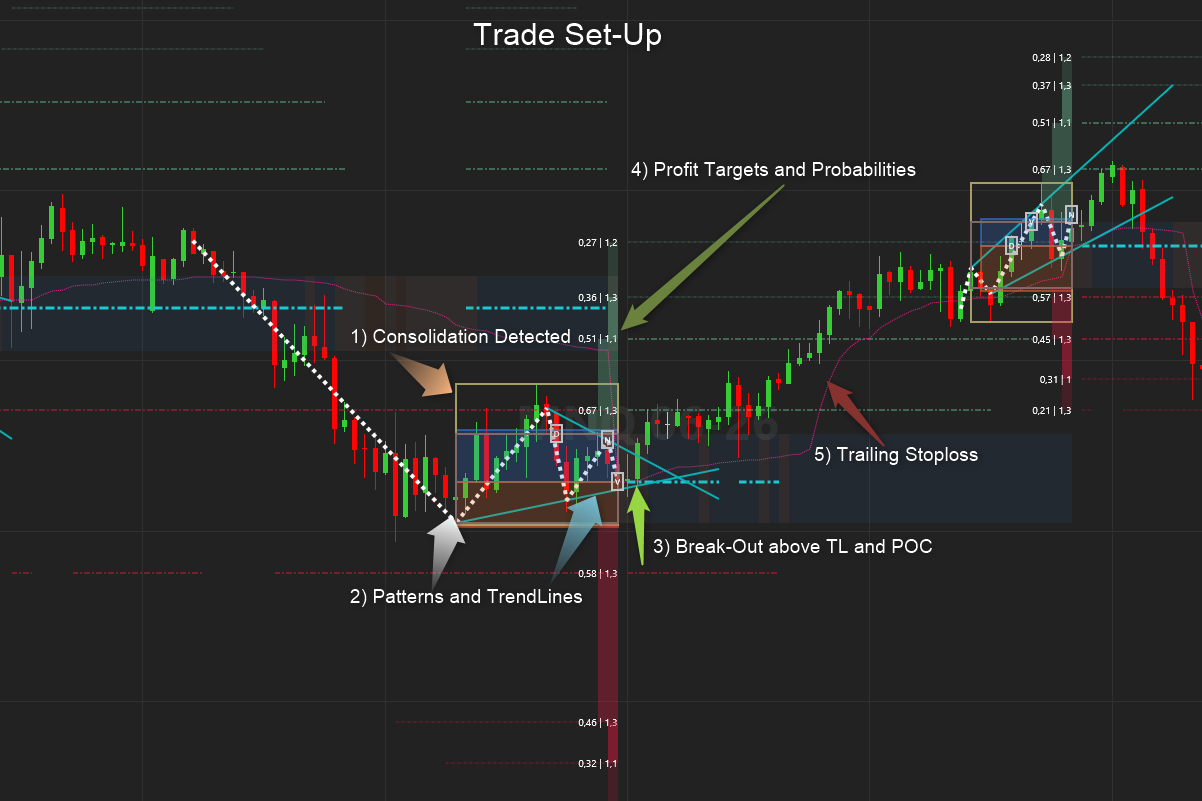
Q-Profiler
The Q-Profiler Indicator combines the power of Volume Profile with dynamic trend analysis, support, and resistance — giving traders a smarter way to see where the market truly values price.
Click the link below to learn more.
Q-Bars
Q-Bars combines all of the great features of our Heat and Smart Bars indicators. We have also added our Power Wicks indicator to the mix. This indicator looks at the delta of buying and selling pressure and the shifts therein.
Click the link below to learn more.
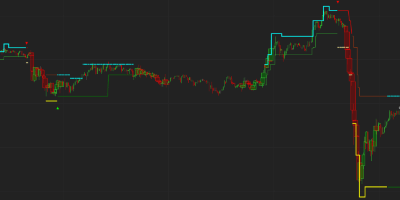
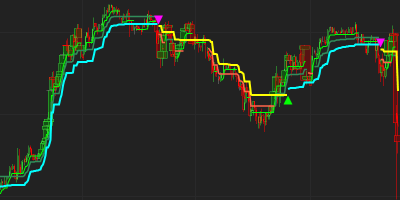
Trend Absorption
This indicator starts with detecting the current trend as efficiently as possible utilizing past and current support and resistance levels. It detects the trend changes as fast as possible with the least amount of noise.
Click the link below to learn more.
Market Structure SR
With this indicator we took all of the great features of our Market Structure indicator and added Support and Resistance levels to it.
Click the link below to learn more.
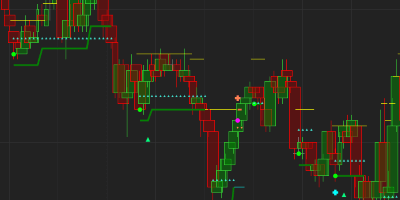
Market Structure
This indicator is designed to decode the underlying rhythm of price movement—revealing transitions between accumulation, expansion, distribution, and contraction phases with precision. Click the link below to learn more
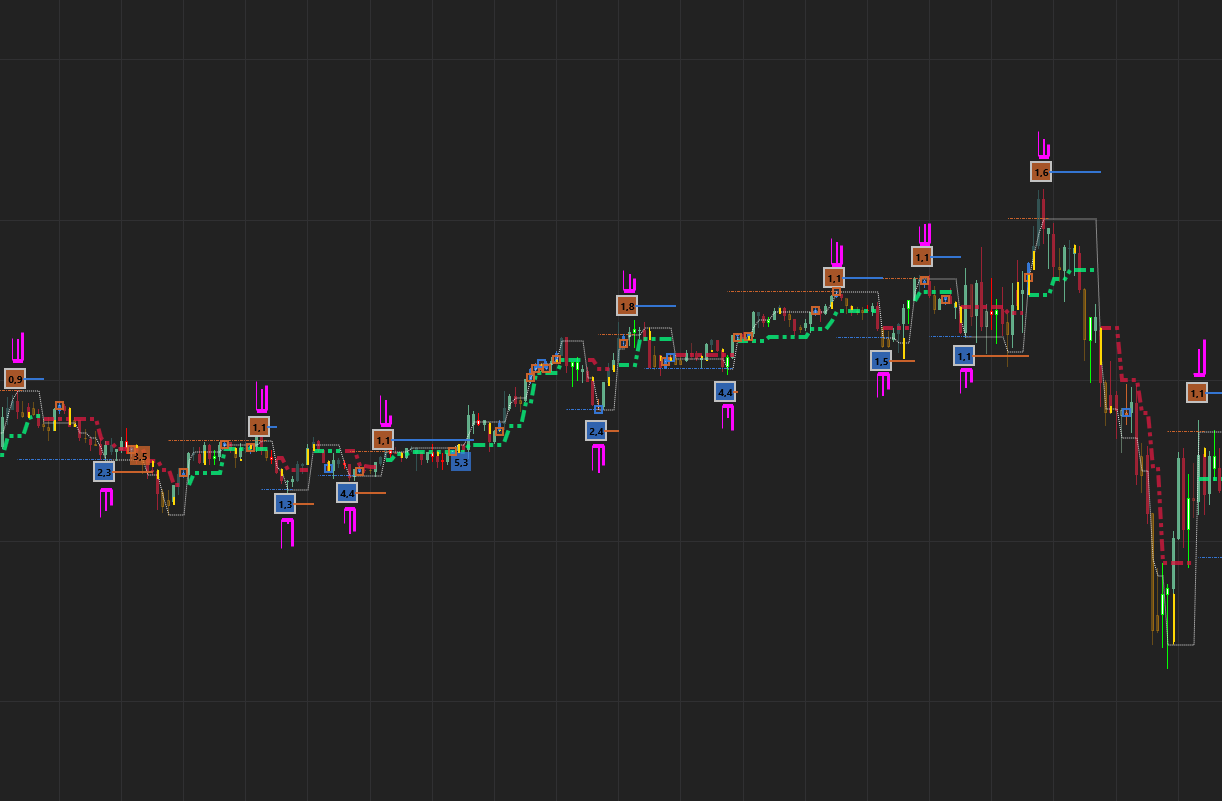
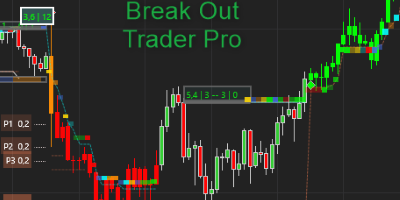
Break-Out Trader
More than just an indicator, Break-Out Trader is our amazing tool that detects consolidations and signal break outs. It also determines profit targets, stoplosses and a whole lot more. Click the link below to learn more.
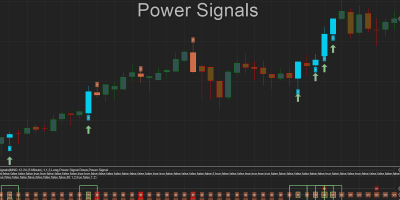
Power Signals
This indicator looks at the flow of interest in the market in terms of volume, volatility and volume delta. Power Signals was developed to help us better develop trading systems and ideas.
LASR
Volume Profile is a trading tool that shows the trading activity at different price levels. It’s like a volume heatmap along the vertical axis of a price chart. By identifying areas where high volumes are traded, you can spot key support and resistance levels.
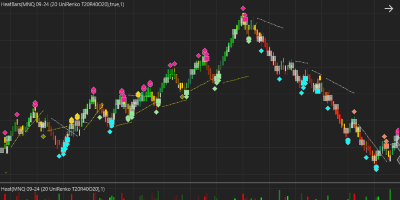
Heat Bundle
This model assigns a weighted value to all the readings that we get from the pool of indicators. We then simply assign a color based on these values and plot it as bars in an Heat indicator and color the bars with the Heat Bar indicator.

Each indicator undergoes rigorous testing in live market conditions before being launched, ensuring reliability and effectiveness on all time frames. Additionally, we take pride in offering exclusive discounts to our newsletter subscribers upon the release of new products.
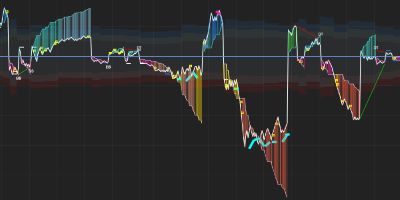
Volume Based Indicators
Q-Smart Bars
Every bar contains information. We miss a lot of valuable information because we filter these bars by time, variance or some other method. There are probably no perfect way to build our bars so the best solution would be to allow our bars to provide us with all the valuable information that we need in a neat, compact and informative manner.

QVPSR
We know how important “to-the-tick” accuracy is, missing an entry by 1 tick or an exit by 1 tick can make All the difference in your P and L. That is why with this Indicator we aim to find the Real Support and the Real resistance. We try to get closer to every tick possible.

Q-Power Wicks
Power Wicks, our innovative indicator, provides a comprehensive analysis of buying and selling dynamics within each bar. It carefully examines market imbalances and plots a wick from the High to Low, extending to the intra-bar VWAP (Volume Weighted Average Price) whenever a significant imbalance or a shift occurs.

Q-Volume Bars
This indicator follows the “Smart Money” in the market. We have found that it is not simply enough to Only model the volume and price but to filter and define the volume to find the Smart Money movements within the volume.

Money Flow
This indicator uses two secret tools: volume profiling and volatility. These tools act like special glasses that help us see through the noise and spot the real patterns in the market. Eager to decode market signals amidst the noise? Experience the difference with our approach using volume profiling and volatility measures. Click the link to explore all the features.

Q-VWAP
VWAP starts calculating this average at the start of the trading day and end at the close of the market. VWAP is a very handy Indicator for day traders as it gives you a lot of information on the current day’s trend, variance, support and resistance.

Happy Client
-
I would like to congratulate you on RM trader. Wow….what a great tool, especially for scalping. There is nothing like this on the market that produces such consistently solid SR levels, particularly on lower timeframes. QVPSR is also very good. The two together are a scalpers wet dream.
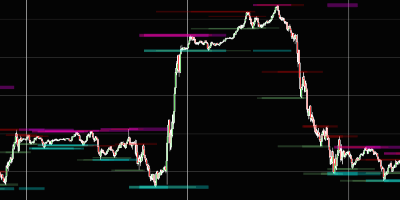
Support and Resistance Indicators
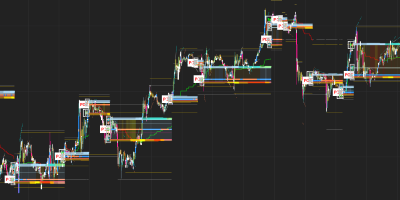
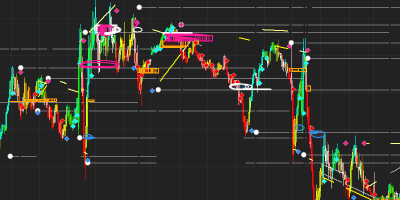
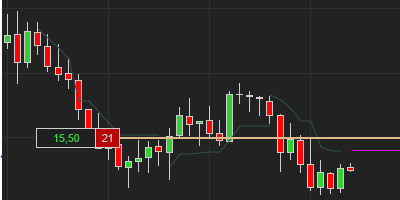
RM Trader
Are you ready to elevate your trading game? Say hello to RM Trader, your ultimate companion in navigating the dynamic markets. This cutting-edge indicator harnesses the power of Volume, Ranges, and an array of other metrics to pinpoint Key market levels. Brace yourself for a revolutionary approach that goes beyond mere pivot points.

Q-Scalper
Support and Resistance (SR) are valuable tools in trading, not all SR levels are created equal nor are they even predictive. Finding the ideal SR Level is what Q Scalper does, effectively. This Indicator finds support and resistance levels then test them for significance. It plots all the recent and significant SR levels
Q-SR Pro
QSR Pro: the cutting-edge software designed to elevate your trading game. QSR Pro utilizes our unique algorithm and advanced techniques to identify, validate, and invalidate support and resistance levels like never before. Unlike other indicators that rely solely on swing highs and lows, QSR Pro incorporates multiple factors to ensure precise support and resistance identification.

Q-SR
Support and Resistance levels are levels where the market found it hard to move beyond that level. These levels often determine ranges where the markets will move within or between. When the market breaks above or below these significant levels we can generally expect a big move.
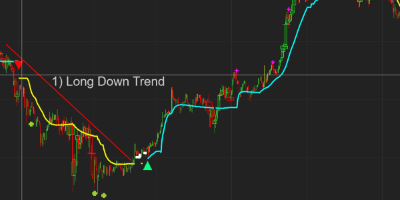
QTL
Trendlines can be drawn in so many incorrect ways. Drawing it incorrectly can make every trade a loser and vice versa, getting it right makes all the difference! QTL has a much faster and a far more accurate approach than any other trend indicator. The indicator automatically finds the short term and longer term trendlines. No back plotting.

QVPSR
We know how important “to-the-tick” accuracy is, missing an entry by 1 tick or an exit by 1 tick can make All the difference in your P and L. That is why with this Indicator we aim to find the Real Support and the Real resistance. We try to get closer to every tick possible. It’s also Great for trading Momentum Break-outs!
Happy Client
-
Hi
Jaco , I am a trader with over 10 years of experience in the financial markets. Your QTL indicator is something extraordinary and fits all strategies perfectly. I am very happy that there are developers who make such fine tools.
Combination Indicators
Q-DNA
This Indicator works on all instruments and All Time Frames. Note that its Not intended for Timeframes >= Day. Plots are customizable and we use custom filtering techniques to filter the data which negates the need for them.
QTL
Trendlines can be drawn in so many incorrect ways. Drawing it incorrectly can make every trade a loser and vice versa, getting it right makes all the difference! QTL has a much faster and far more accurate approach than any other trend indicator. The indicator automatically finds the short and longer term trendlines.
Money Flow
This indicator uses two secret tools: volume profiling and volatility. These tools act like special glasses that help us see through the noise and spot the real patterns in the market. Eager to decode market signals amidst the noise?
Q-Scalper
Support and Resistance (SR) are valuable tools in trading, not all SR levels are created equal nor are they even predictive. Finding the ideal SR Level is what Q Scalper does, effectively. This Indicator finds support and resistance levels then test them for significance. It plots all the recent and significant SR levels
RM Trader
Are you ready to elevate your trading game? Say hello to RM Trader, your ultimate companion in navigating the dynamic markets. This cutting-edge indicator harnesses the power of Volume, Ranges, and an array of other metrics to pinpoint Key market levels.
QVPSR
We know how important “to-the-tick” accuracy is, missing an entry by 1 tick or an exit by 1 tick can make All the difference in your P and L. That is why with this Indicator we aim to find the Real Support and the Real resistance. We try to get closer to every tick possible. It’s also Great for trading Momentum Break-outs!
Happy Client
-
If you are looking for the indicator that encompasses multiple solutions the QScalper is the perfect indicator. It was made by a developer who is also a trader and he knows what happens every day on the financial markets.
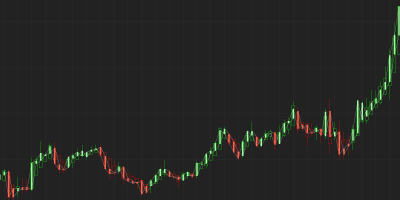
Bar Type Indicators
Q-Smart Bars
Every bar contains information. We miss a lot of valuable information because we filter these bars by time, variance or some other method. There are probably no perfect way to build our bars so the best solution would be to allow our bars to provide us with all the valuable information that we need in a neat and informative manner.
Q-Power Wicks
Power Wicks, our innovative indicator, provides a comprehensive analysis of buying and selling dynamics within each bar. It carefully examines market imbalances and plots a wick from the High to Low, extending to the intra-bar VWAP (Volume Weighted Average Price) whenever a significant imbalance or a shift occurs.
Q-Volume Bars
This indicator follows the “Smart Money” in the market. We have found that it is not simply enough to Only model the volume and price but to filter and define the volume to find the Smart Money movements within the volume. We also know and saw that the market moves from periods of interest, no interest and back again.
Q-OCF
Bar types like Heikin-Ashi, Renko, and Range Bars are favored for their ability to filter out market noise and provide clearer trend direction, However, a significant drawback is their inability to display the actual open and close prices, which is crucial for accurate analysis and strategy development. Check out our OCF Indicator now.
Happy Client
-
Smart Bars and Volume Bars are essential tools for defining what’s happening intra-bar. I combine it with other tools to pinpoint entries.
Reversion/ Reversals Indicators
Q-Dots
This Indicator is best suited to non-trending/ range-bound markets. When the market gets overbought or over sold it accurately finds the level where the market should revert back to a mean. Click the link below to see a slideshow.
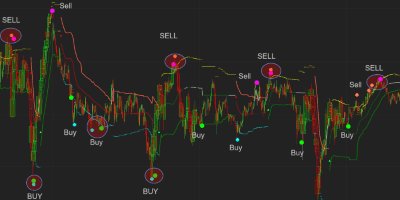
Q-Reversals
Good Reversal setups present themselves when the market has broken out of a range and has moved considerably beyond that range. At this point the market gets exhausted and a reversal becomes imminent. Click the link below to see a slideshow.
Quasar
Quasar finds Large Reversions fast. With this Indicator parameters can be optimized and works great out of the box. It also works on all time frames, instruments and bar types. Click the link below to see a slideshow with examples of how this indie works well.
RM Trader
Are you ready to elevate your trading game? Say hello to RM Trader, your ultimate companion in navigating the dynamic markets. This cutting-edge indicator harnesses the power of Volume, Ranges, and an array of other metrics to pinpoint Key market levels.
Happy Client
-
I have been using Quaderr Indicators for over two years now. I will not trade without Quasar NT8 on my chart. Great Indicator development from Jaco and the customer service is exceptional. Thanks for all the great Indicators.
Trend & Momentum Indicators
Q-TSL
This indicator will take care of all your stoploss needs. We wanted to find a definitive solution that is robust and effective. SL and TSL should adapt to the volatility , noise, trend and price action of the current market conditions. It should be slow in choppy conditions, fast in trending and very fast in “super trend” conditions.
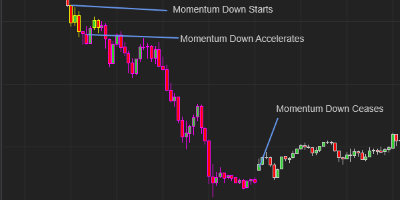
Q-Momentum
This Indicator’s purpose is to detect when the market increases or decreases momentum. Momentum simply explains when the market starts trending stronger in its current trend. We like to use this indicator to help with determining good exit levels for profit targets. for more info, click the link below.
3 Trends
Our 3 Trends indicator use this proprietary filtering techniques to remove most of the whipsaw and give you accurate trend changes fast. It comprises of a slow curve, a medium curve and a fast curve. Trend Indicators generally performs best in markets with low volatility and strong trends.
Q-TSL Plots
This indicator uses our Q-TSL indicator to plot a TSL level when you have a position. Whilst your account has no position it will only plot the initial stoploss levels along with the position size. The indicator will plot two parallel lines indicating the suggested initial stoploss levels along with the position size to be traded.
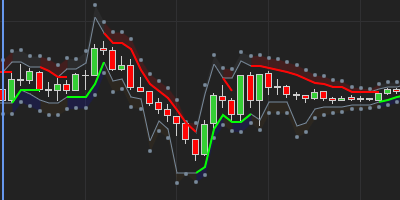
Q-Curve
Q-Curve is a trend following indicator that looks for reversals. We need a long consistent trend in the same direction to start. We then look for the reversion points to appear on the chart. These points indicate when the market is finding resistance after an extended trend. Click the link below to view a slideshow and more info.
QTL
Trendlines can be drawn in so many incorrect ways. Drawing it incorrectly can make every trade a loser and vice versa, getting it right makes all the difference! QTL has a much faster and far more accurate approach than any other trend indicator. The indicator automatically finds the short and longer term trendlines.
Happy Client
-
I have cycled thru many price and volume based trend indicators through the years: Q-curve is by far the most accurate, flexible, and consistent trend indicator I have found. I use it for medium trend identification scalping ES futures.
Patterns Indicators
Q-DNA
This Indicator works on all instruments and All Time Frames. Note that its Not intended for Timeframes >= Day. Plots are customizable and we use custom filtering techniques to filter the data which negates the need for them.
