CBO Patterns
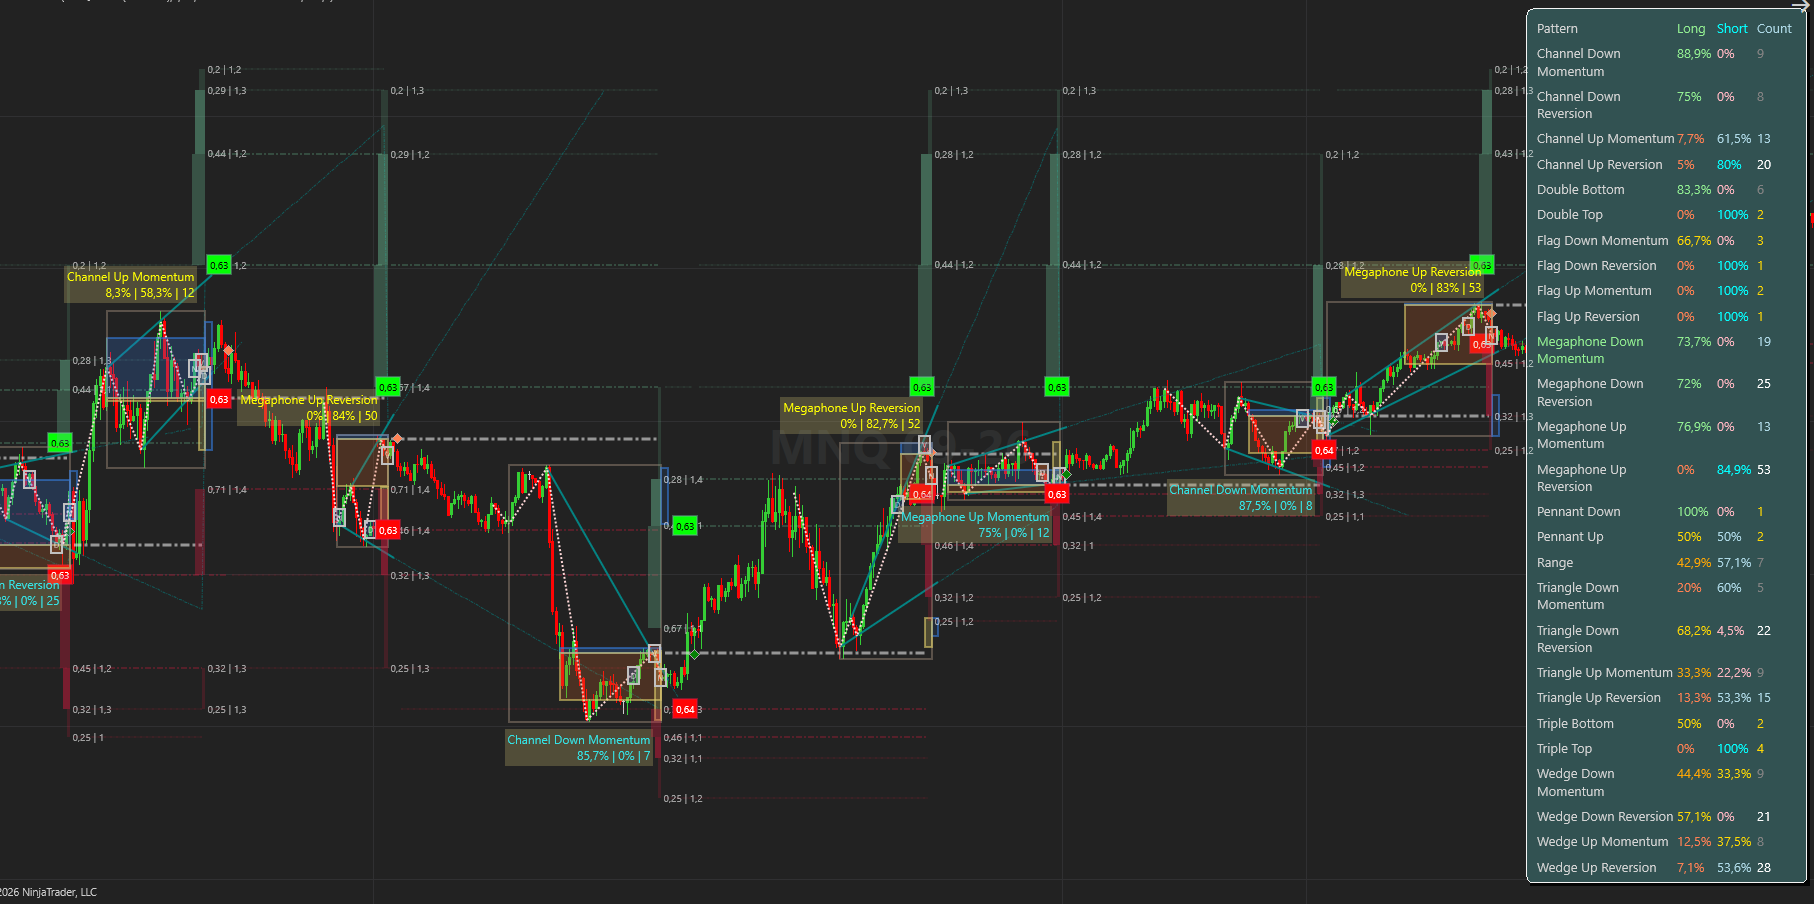
CBO Patterns – Probability‑Driven Chart Pattern Recognition
CBO Patterns is the next evolution of our CBO Indicator. It doesn’t just highlight breakout zones — it identifies the chart pattern forming inside each consolidation, calculates probabilities for long and short moves, and projects realistic profit targets based on historical support/resistance. With CBO Patterns, you trade with clarity, confidence, and statistical edge.
New Features Compared to CBO
- Pattern Recognition
- Probability Forecasting
- Target Grid & Likely Target
- Pattern Dashboard
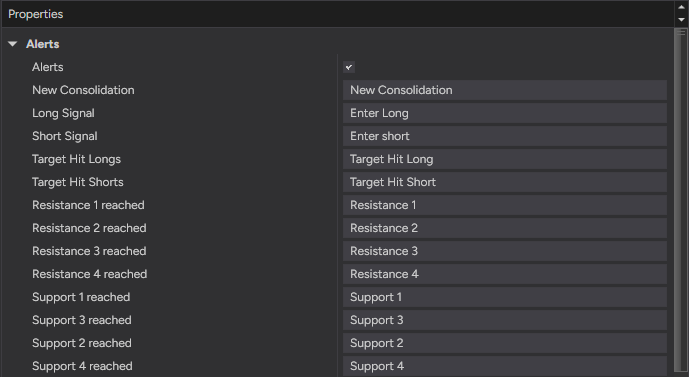
- More Voice Alerts
Why It Matters
- Trade smarter by focusing only on statistically significant setups.
- React faster with spoken alerts that keep you informed without staring at the screen.
- Manage risk better by knowing the probability of each target being hit.
- Gain deeper insight into market structure with a dashboard view of all active patterns.
How it works :
- Detect consolidation – The indicator first identifies when price action enters a consolidation zone.
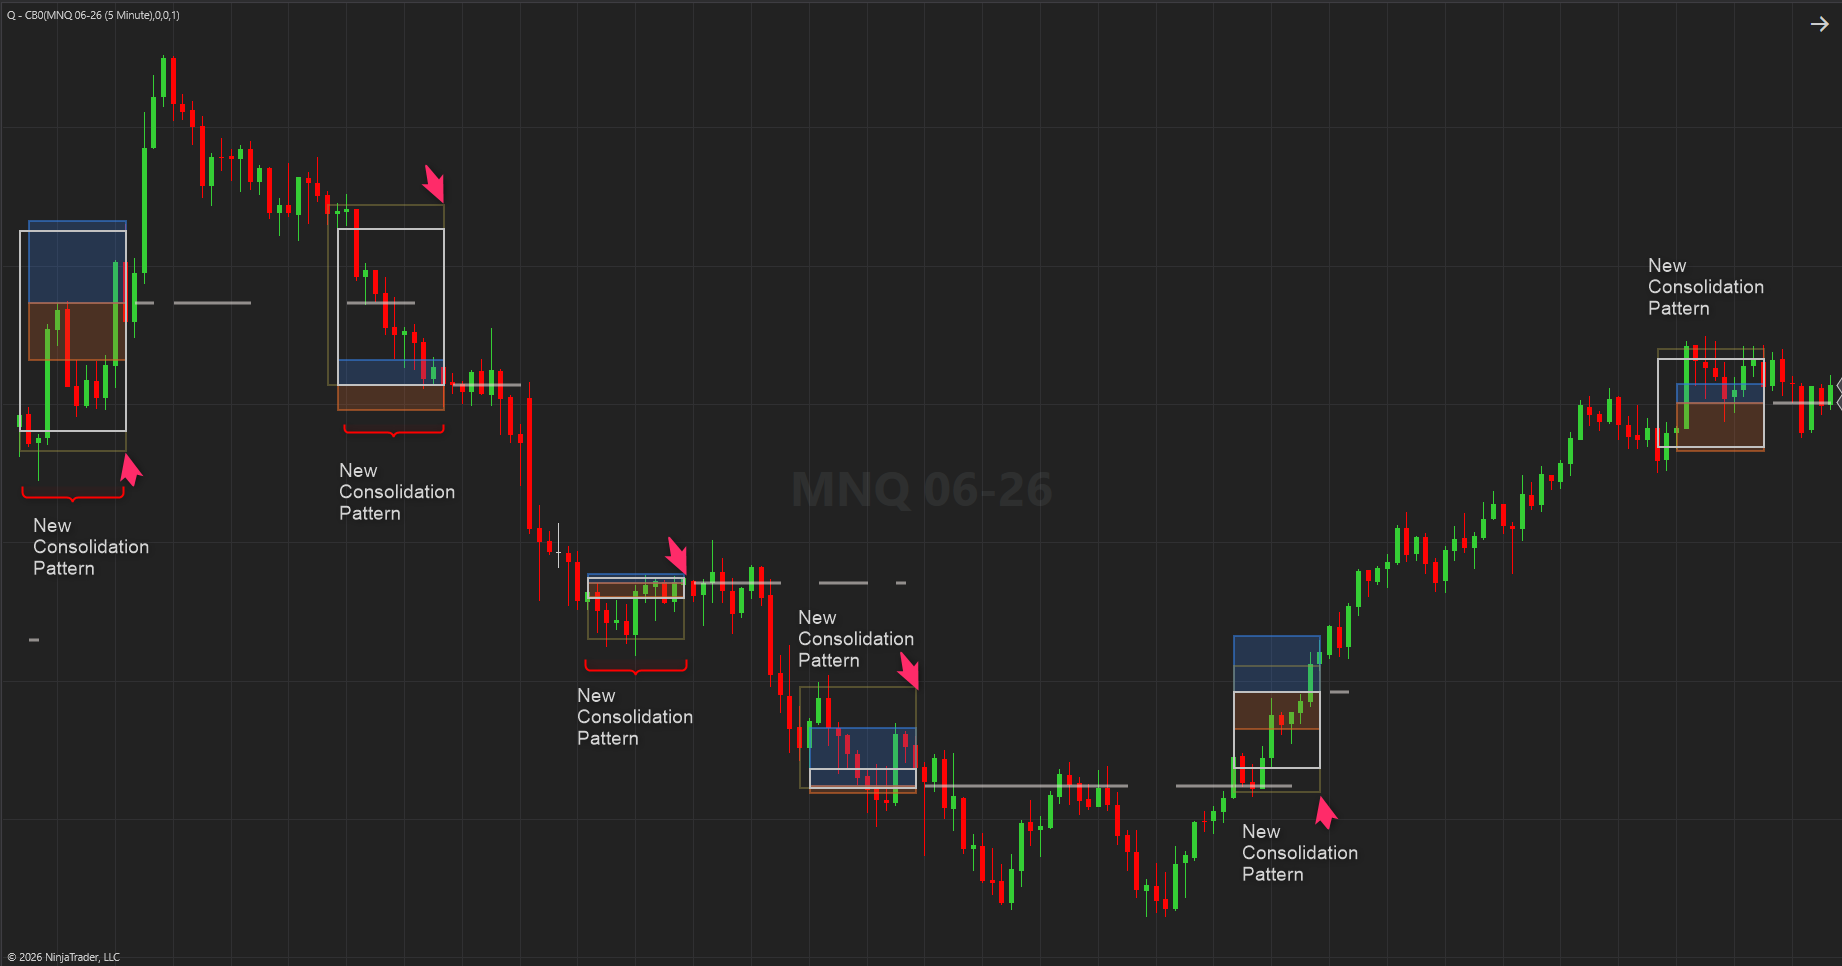
2. Recognize chart pattern It determines which chart pattern (flag, wedge, pennant, etc.) best fits that consolidation and labels it on the chart.
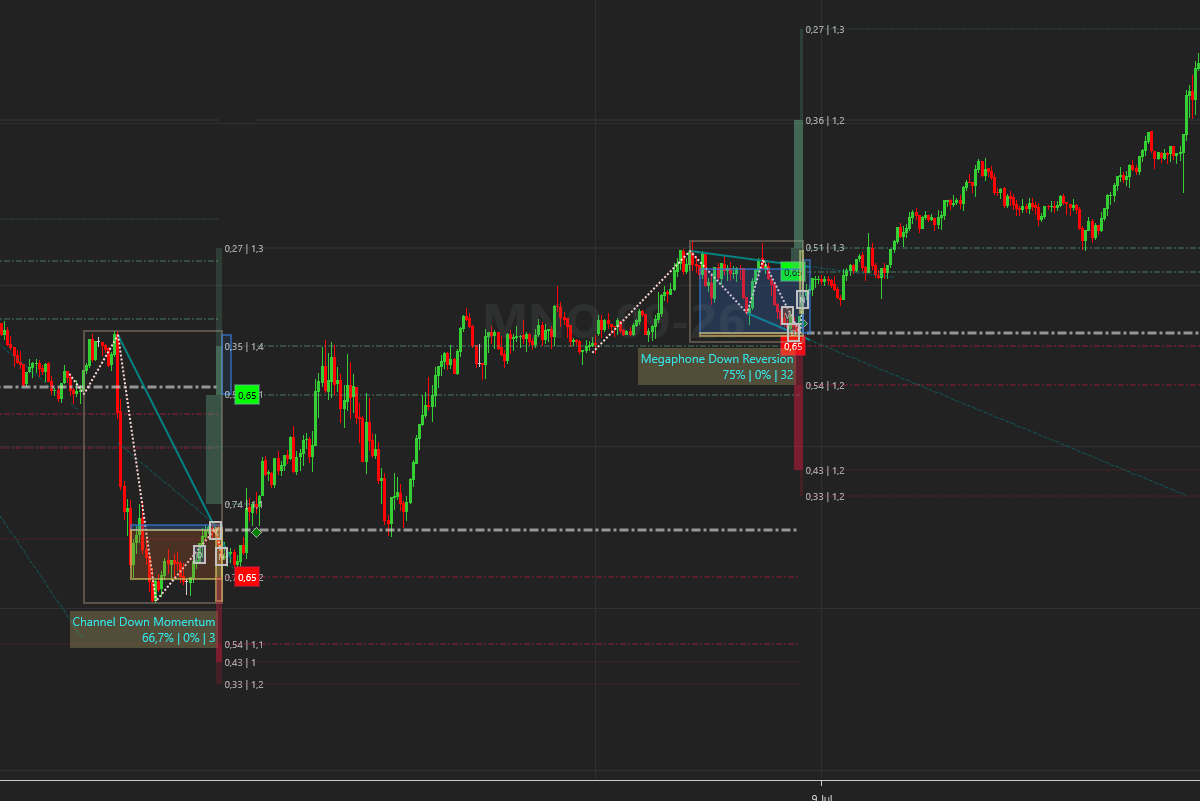
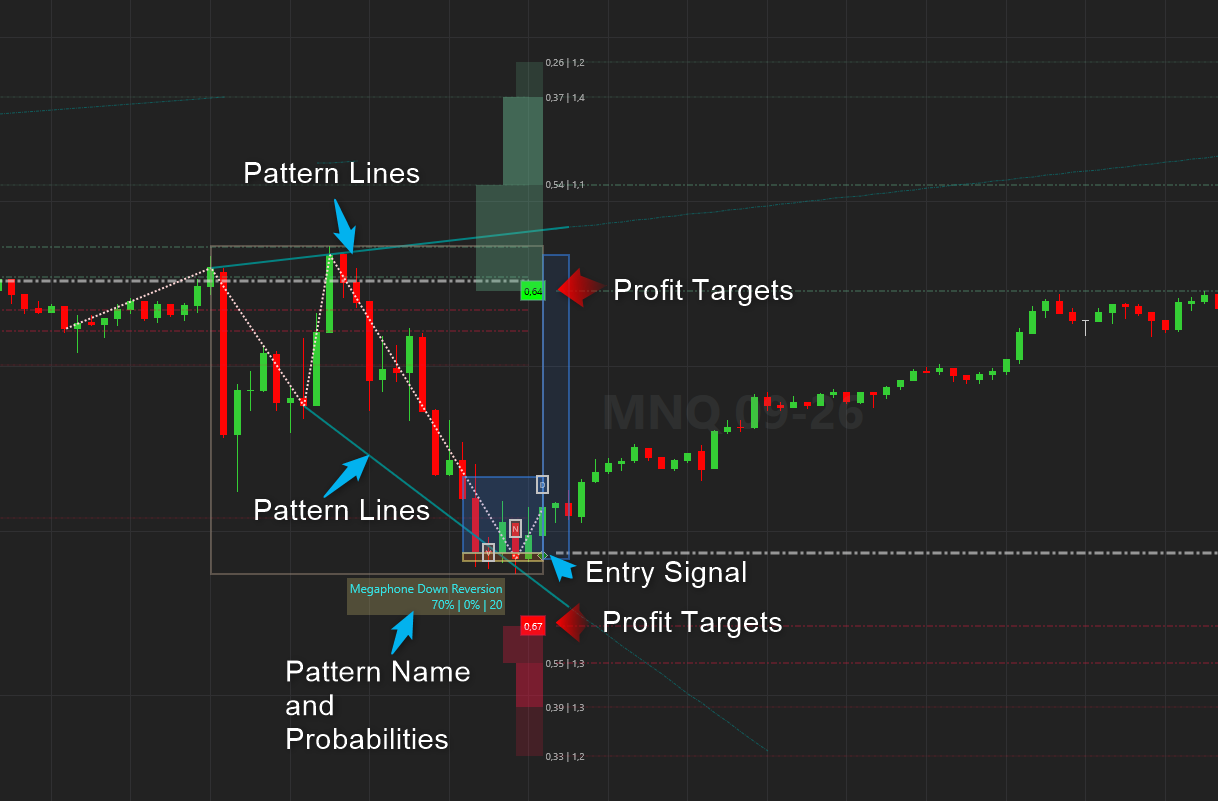
3. Calculate probabilities : For each pattern, it computes the probability of a successful long or short breakout. a Long break before a Short break or vice versa
4. Set target grid: Using prior support/resistance levels, it plots a grid of potential targets and highlights the most likely one, along with its probability of being reached.
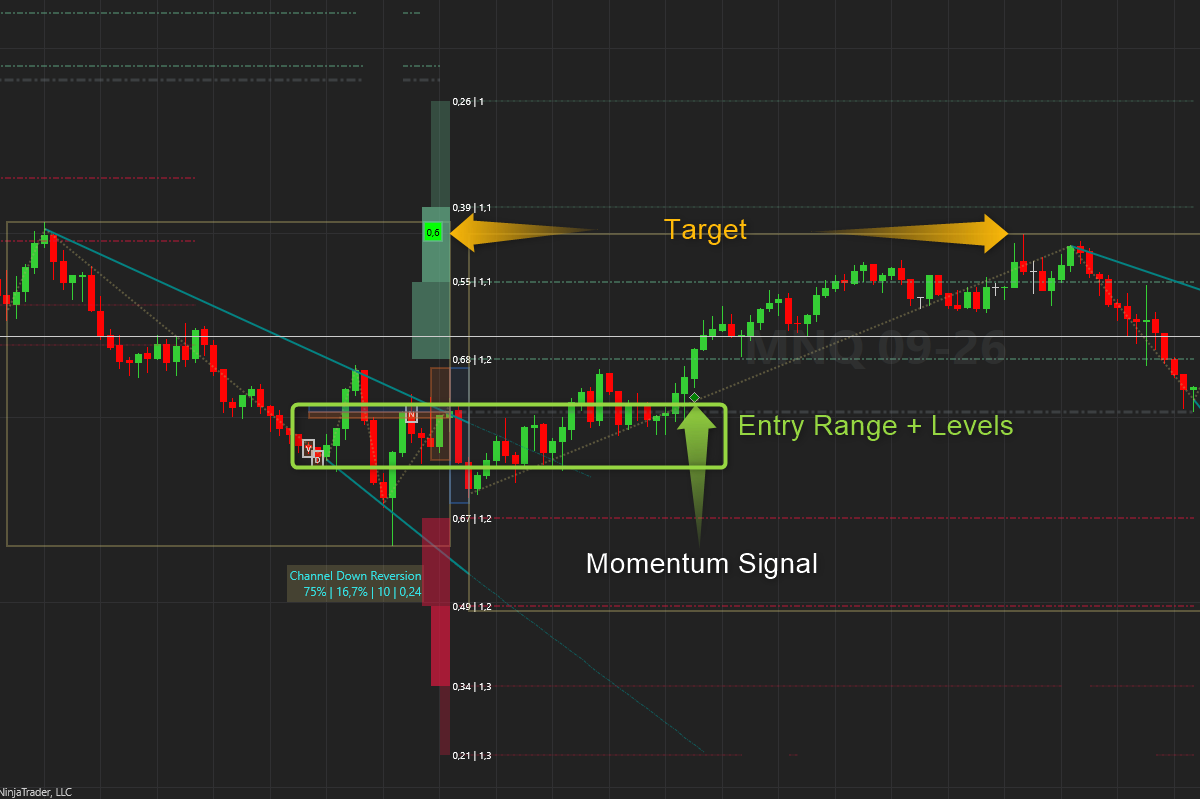
5. Trigger entry signals : When a breakout occurs, the indicator confirms the entry
6. Set Profit Targets : Based on levels that produces high probabilities of being reached. It also shows the probabilities of these targets being reached
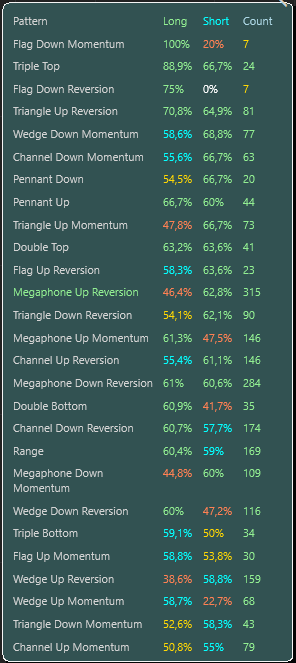
7. Update dashboard : A dashboard displays all active patterns, their frequency, and probabilities for long/short moves.
8. Voice alerts : Spoken alerts announce new consolidations, entry signals, and when targets or SR levels are hit.
Signals
Momentum Signal
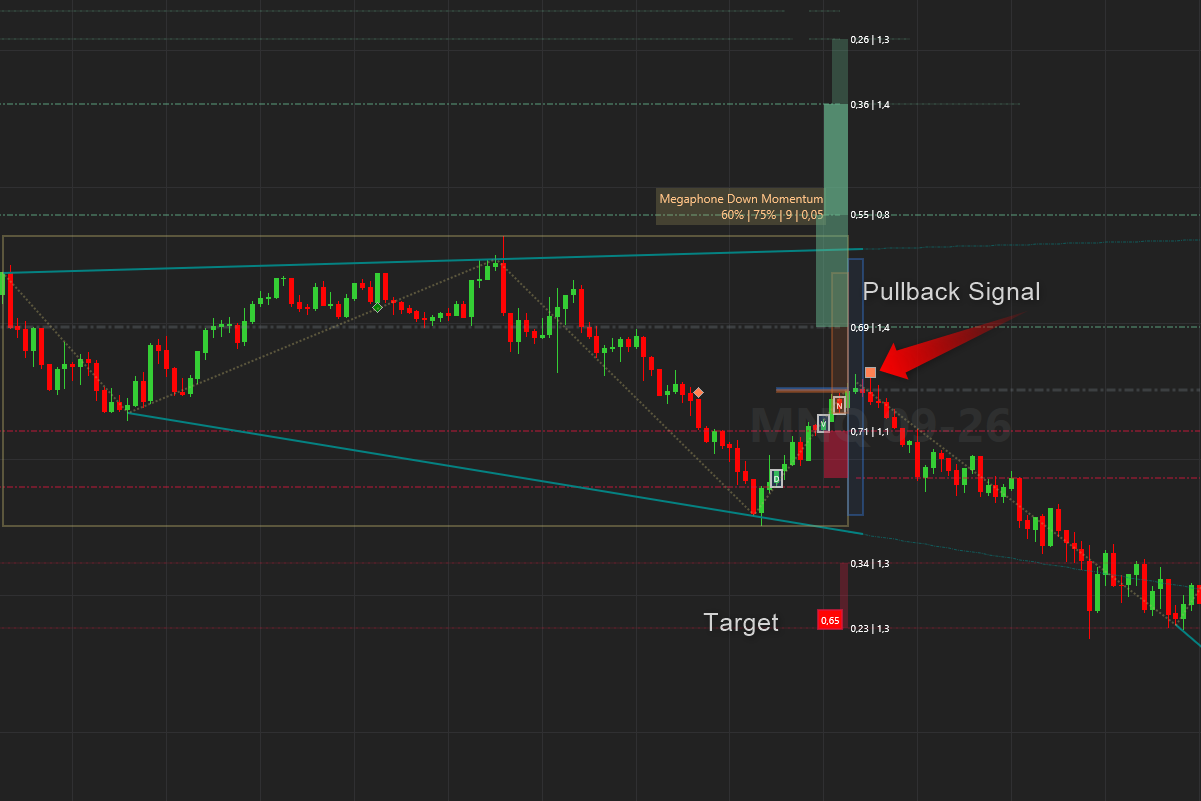
Pullback Signal
 Dashboard
 Dashboard
 We have added a dashboard that displays all the patterns along with their probabilities of leading to a successful long or short move after the consolidation.
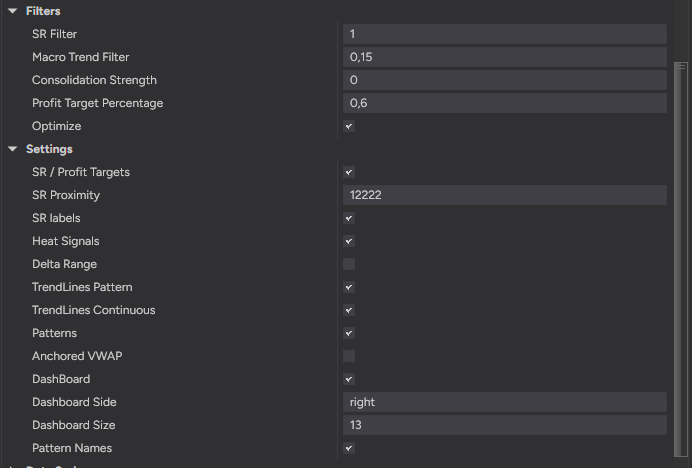
The Dashboard`s position can be set to left or right .
The Size of the dashboard can be changed
Auto Trendlines
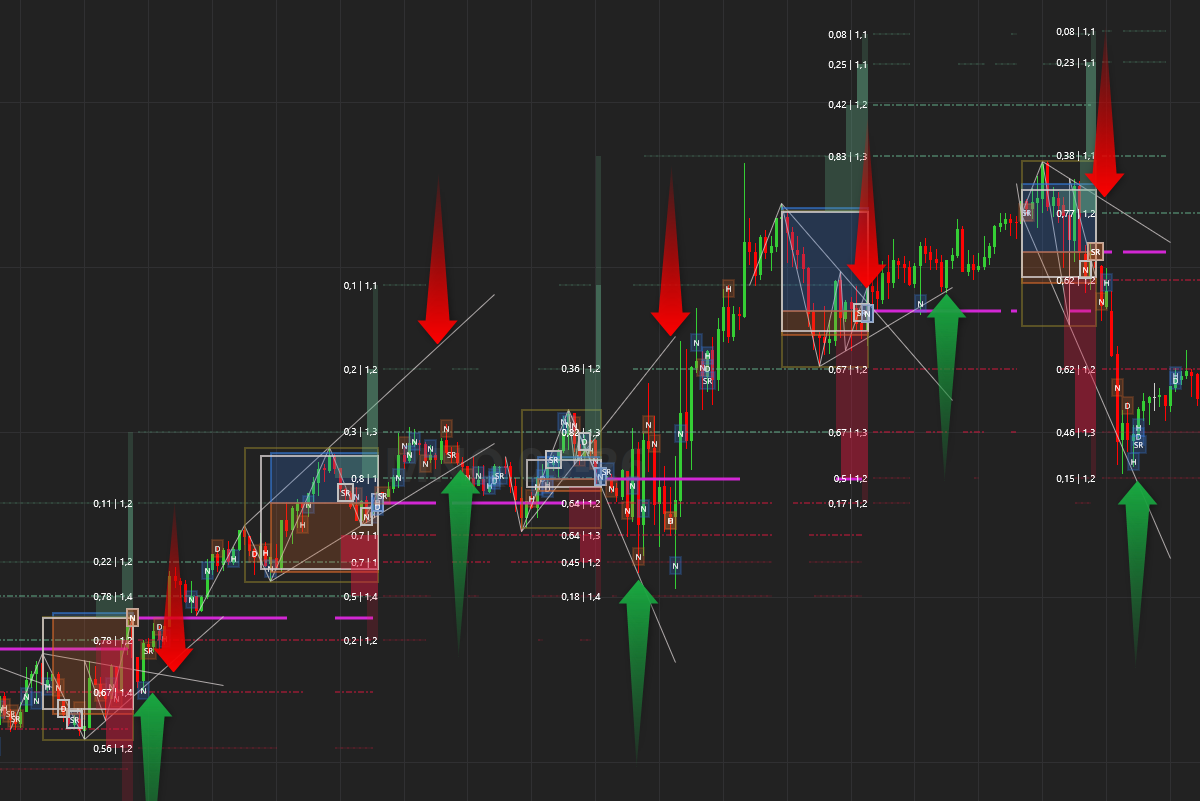
These trendlines are very helpful with defining entry levels as well as projecting where the price might go after the consolidation. They also offer good support and resistance levels in a trend which are great for pullback trades. Price levels where support and resistance levels intersect with trendlines creates very significant levels to trade from.
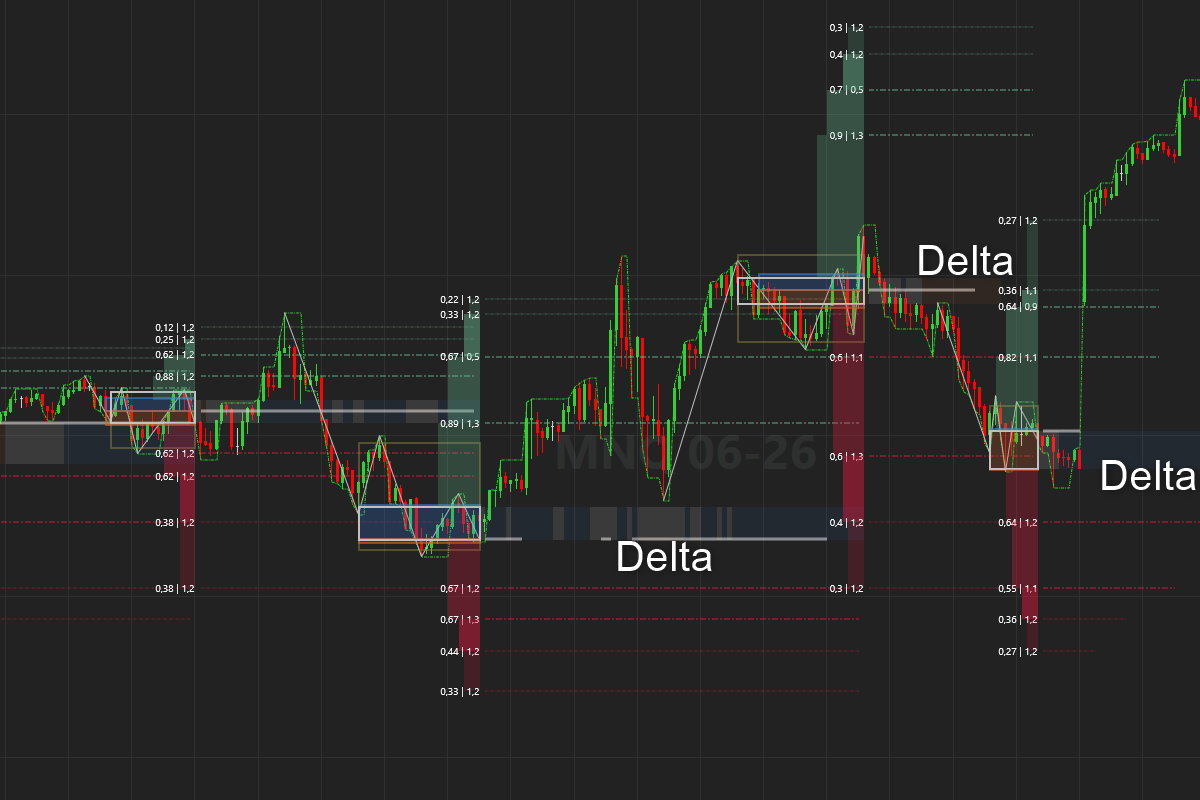
We calculate the cumulative delta from when a new consolidation is confirmed. This helps to determine if the buyers or sellers are in control. Delta flips makes for good trade setups as it shows the shift in buyer vs seller behavior
Anchored VWAP
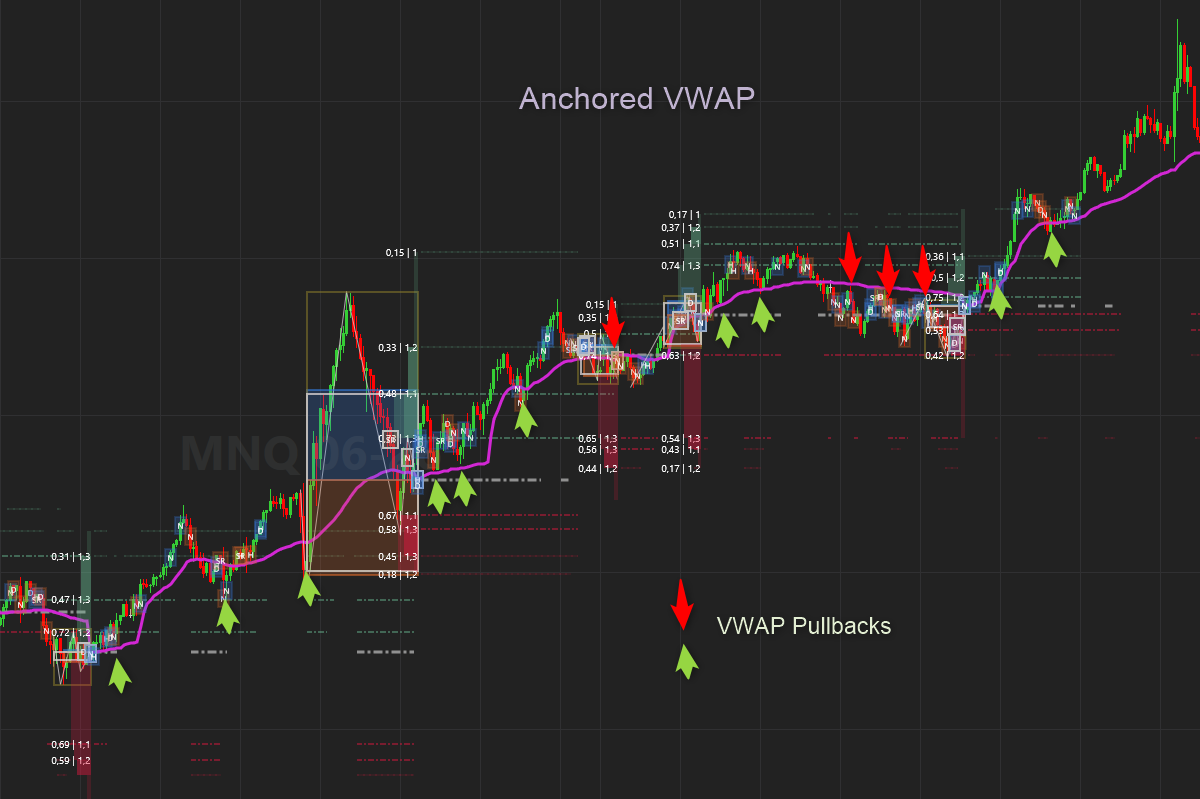
This indicator anchors the VWAP when a new consolidation is formed. This is an ideal time to anchor a VWAP as the consolation should precede a new trend with the VWAP defining the new trend. Its really helpful to use as a trialing stoploss or trade pullbacks from the VWAP level in the trend direction
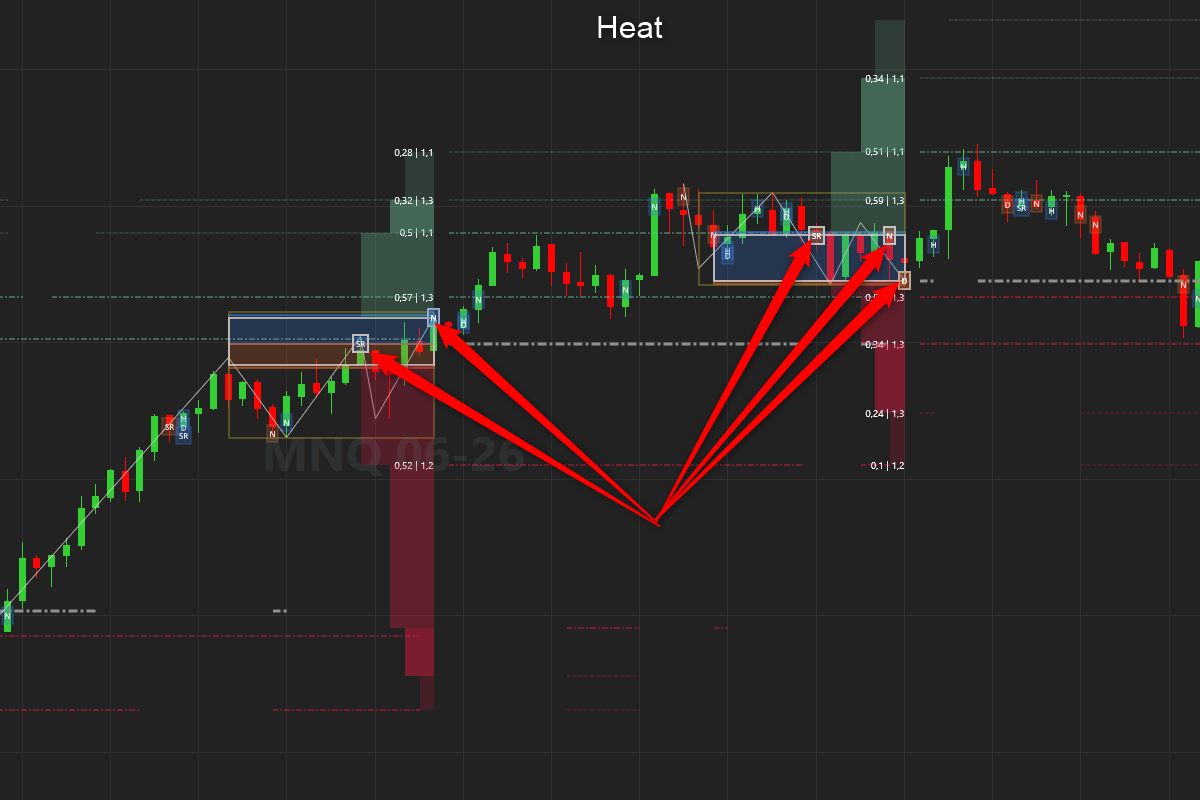
We have included some of the features of our Q-Bars / Heat Bars indicators in this indicator.. The patterns , VWAP, Cum Delta etc. shows us the context or the larger picture. The Heat shows us the micro or intrabar information that we need.
Comparison between CBO And CBO Patterns
| Feature | Original CBO | CBO Patterns |
|---|---|---|
| Consolidation detection | ✔ | ✔ |
| Breakout signals | ✘ |
✔ |
| Pattern recognition | ✘ | ✔ |
| Probability Target forecasting | ✘ | ✔ |
| Target grid + Probabilities | ✔ | ✔ |
| Dashboard | ✘ | ✔ |
| Voice alerts | Limited | Expanded |
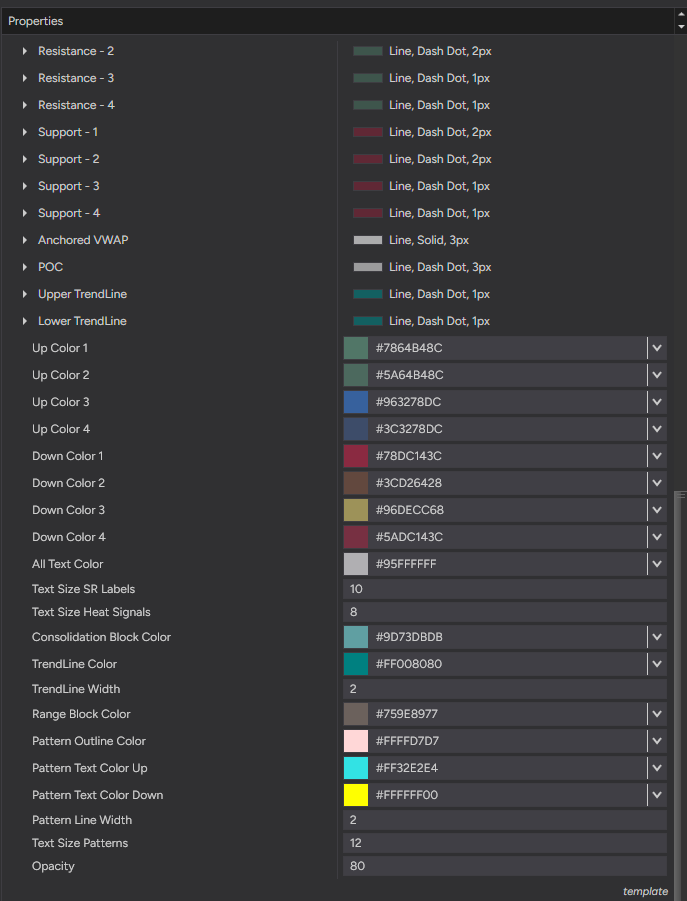
Settings
Plots can be customized and configured for most styling options.
Elevate your breakout trading with CBO Patterns.