HeatBars

  1. Home
  2. /
  3. downloads
  4. /
  5. HeatBars

HeatBars

Most of us use a bunch of indicators to tell us the states of the trend, momentum, volume, volatility and other variables. It can become quite daunting to figure out just what is really going on in the market. We can get many confusing signals by using all our indicators.

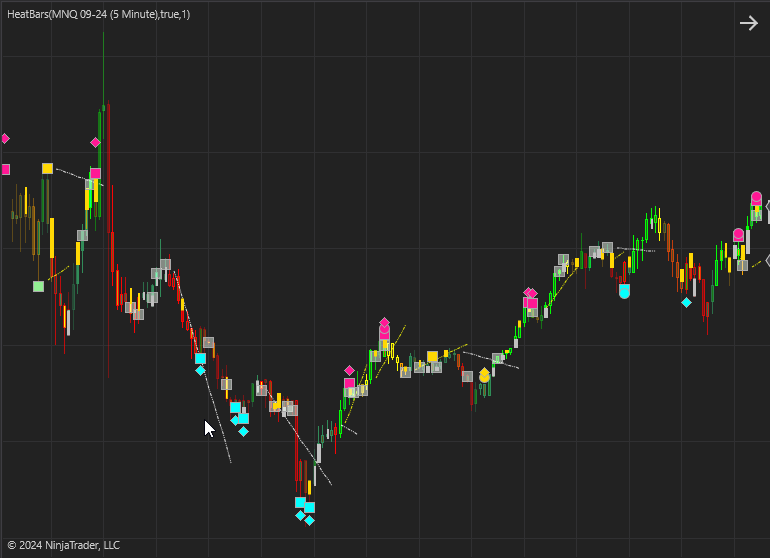
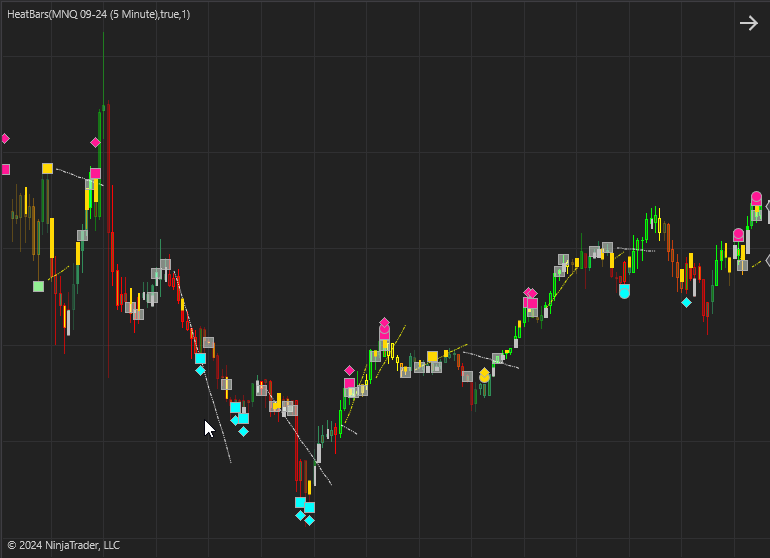
We have created a model that combines a whole bunch of our best indicators in to One indicator. This model assigns a weighted value to all the readings that we get from the pool of indicators. We then simply assign a color based on these values and plot it as bars in an Heat indicator (Oscillator) and color the price bars with the Heat Bar indicator. The goal is to let the colors show us the way. This helps us consciously and subconsciously to get a “feel” for the market.

The color changes are dependent on trend , momentum and volatility metrics and the brightness of the colors change with the volume metrics.

We have created 2 indicators for the Ninjatrader platform to help with this. The Heat indicator is an oscillator that can be plotted above or below your price chart and the Heat Bars indicator will change the bar colors of the price chart..
Color Scheme

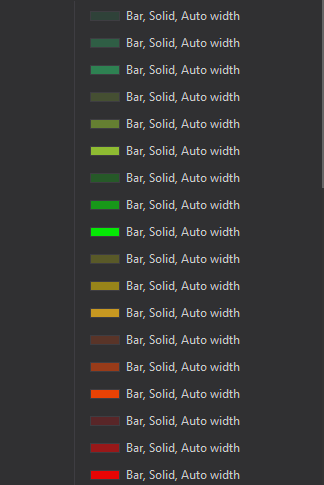
We use a basic color scheme that changes from Yellow, to Orange and then Red for the negative values. Sea Green (dull green) to Yellow Green and finally Lime for the positive values. These colors are all customisable.
Heat Current Bar

The bars plotted above the 0 line shows the “heat” experienced in every bar.

The brightness (opacity) changes with Volume metrics. The Brighter , the stronger

Heat Trend

The bars plotted below the 0 line shows the current trend and changes in the trend. Red would indicate a strong downtrend and Yellow a weak downtrend.

MORE PRODUCTS YOU MAY LIKE

We pick out some of our products

VPSR

Introduction to VPSR This Ninjatrader Indicator is based on Volume Profile.  It’s an amazing tool for finding break-outs and support and resistance. Volume Profile is a very effective means of finding support and resistance. These SR levels often repeat in to the future. The market has some memory. These levels are not necessarily swing highs or lows. […]
$290.00

Q- Dynamic Ranges NT8

  Dynamic Ranges is one of our Free Ninjatrader Indicators. Try it now. Browse our other free indicators here: https://quaderr.com/free-indicators/ Free – Add to Cart CheckOut Added to cart

Q-Volume NT8

Q-Volume is a Free Indicator for Ninjatrader users. Q – Volume for NT8 Volume is one of the best forecasters of price movements. Large and steep price moves coupled with increased and significant volume at the end of the move signals a very likely reversal point and at the very least a new significant support […]

Q-Fibonacci Retracements NT8

If you like Fibonacci and see the potential in it`s ratios you will like our suite of Fibonacci indicators. First we use our algorithm to detect trend changes. Once a trend is signaled the Fibonacci levels are drawn relative to the current and past trends. This is a free indicator for all Ninjatrader users. To […]

Trend Absorption

This indicator starts with detecting the current trend as efficiently as possible utilizing past and current support and resistance levels. It detects the trend changes as fast as possible with the least amount of noise . It then looks at the volume, volatility and delta inside the trend to determine the point when the selling […]
$350.00
ADDED TO CART