LASR
Volume Profile
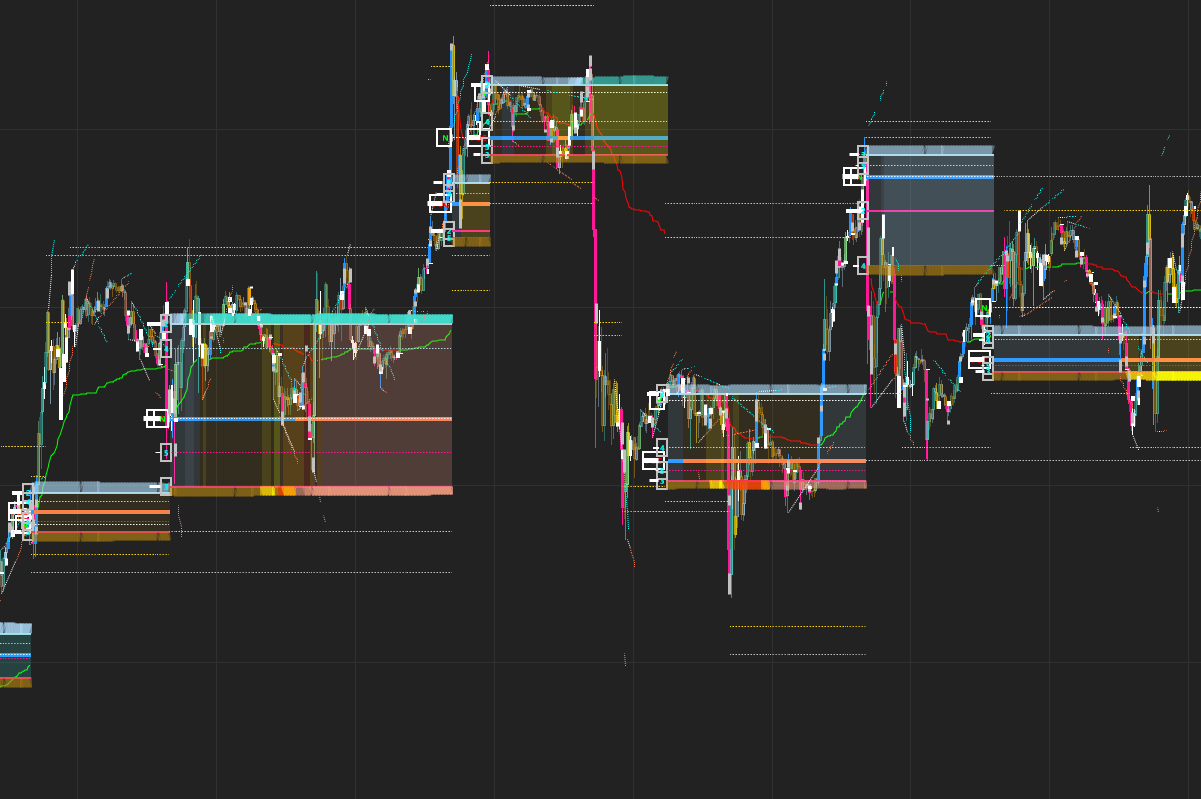
Volume Profile is a trading tool that shows the trading activity at different price levels. It’s like a volume heatmap along the vertical axis of a price chart. By identifying areas where high volumes are traded, you can spot key support and resistance levels. The higher the volume at a price, the stronger the level.
High-volume nodes signify strong support or resistance, where prices often consolidate. Low-volume nodes show areas with little trading, allowing prices to move quickly through them.
Our Approach – LASR
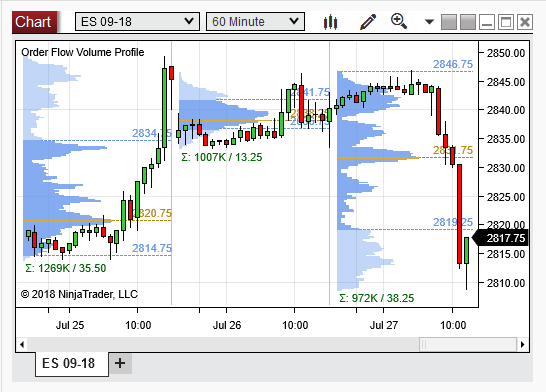
We have created our LASR indicator to improve on this already great concept.
We did this by using Volume that is filtered to produce the Smart Money Volume and instead of using price levels and adding up all the volume at each level we instead use intra-bar support and resistance levels and a Volume metric that is filtered to produce the Smart Money Volume.
Our Volume Profile is not static as it “spawns” new Volume Profiles as and when the market signals them. Kind of like a rolling Volume Profile. No need to decide how many days to include in the profile. This is done naturally as the market evolves.
Then it uses the High and Low Volume / ( Support and resistance in our case) Nodes from previous Volume Profile distributions to determine Ranges and to find Levels that act as great Support and Resistance levels.
We have also added some of the best features of some of our other indicators to this tool.
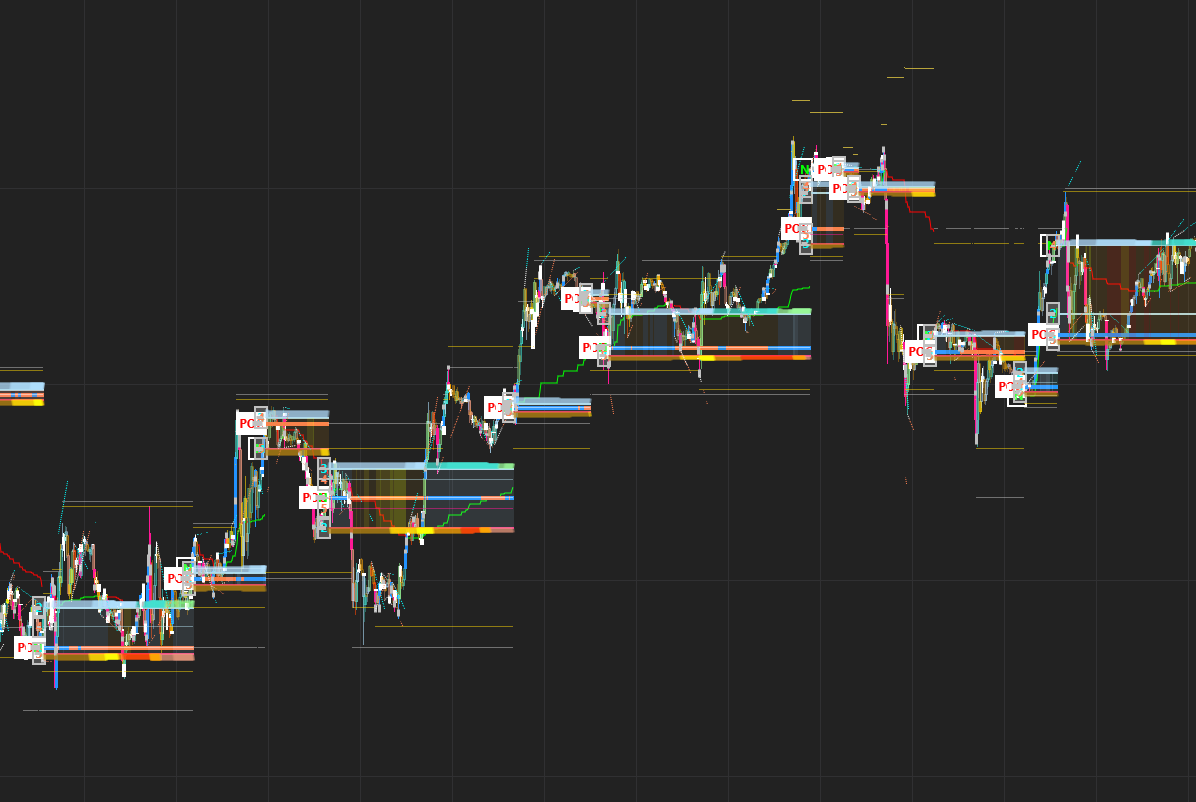
We found that this indicator gives us the best understanding of the market structure and changes in market dynamics!
LASR Volume Profile
When LASR finds / spawns a new Volume Profile distribution it plots the following:
1. The shape of the Volume Profile distribution
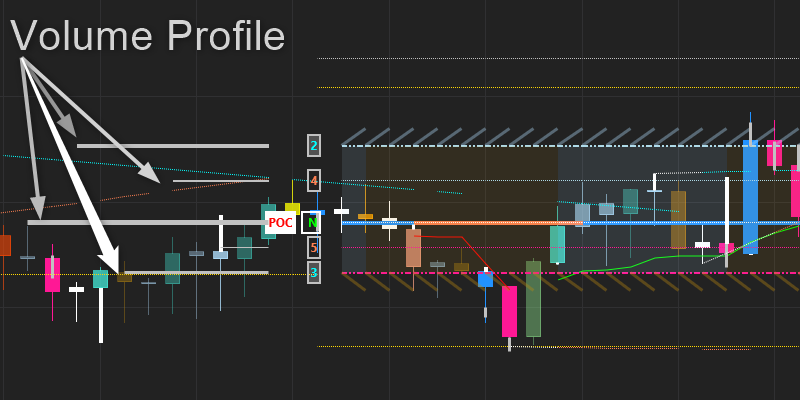
These 5 Horizontal lines show us the relative size / strength of the 5 Levels that we are interested in.
2. The Level`s Ranking
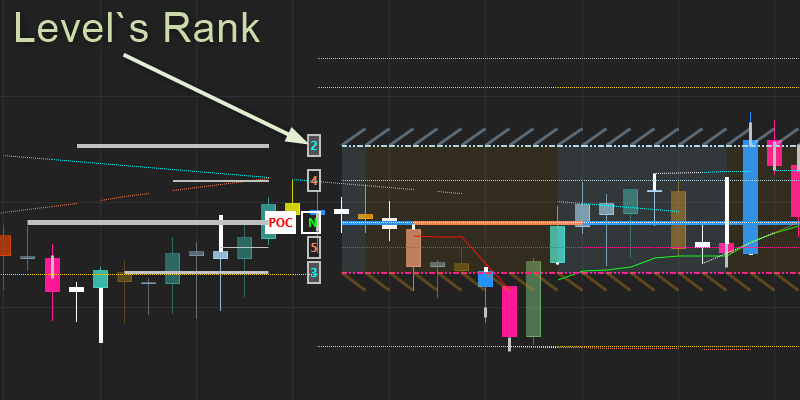
We simply assign a rank to each of these levels signifying their relative size to each other. Number 1 being the strongest and number 5 the weakest of the 5 levels.
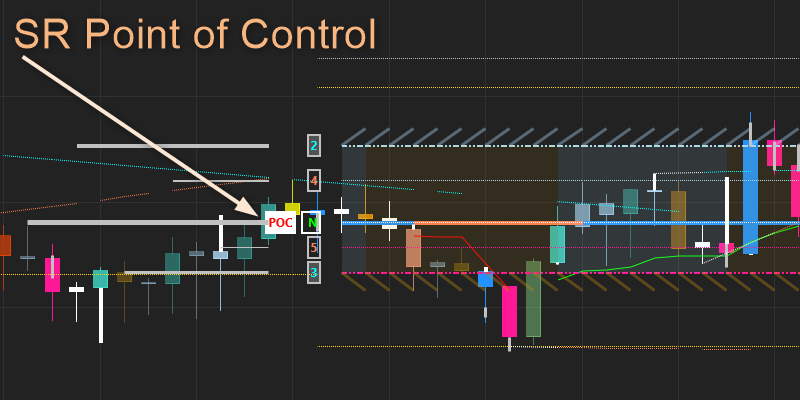
3) Volume Point of Control / SR Point of Control
This is the strongest SR Level in the SR / Volume Profile. The level that experienced the strongest relative support and resistance. The market tends to consolidate around this level.
4) High Volume / SR Nodes
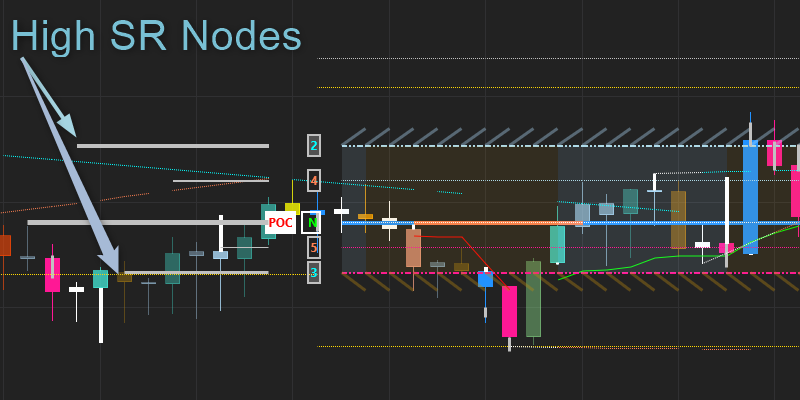
After the SR Point of Control, these are the 2nd and 3rd strongest levels
5) Low Volume SR Nodes
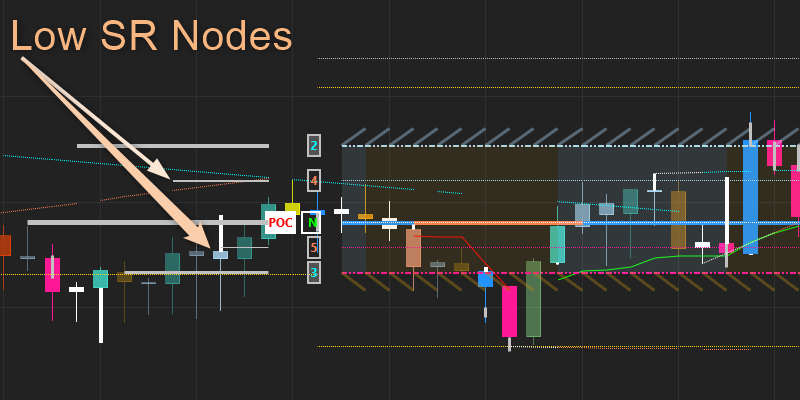
These are the 2 levels with the lowest strength, numbers 4 and 5.
6) Previous SR Levels
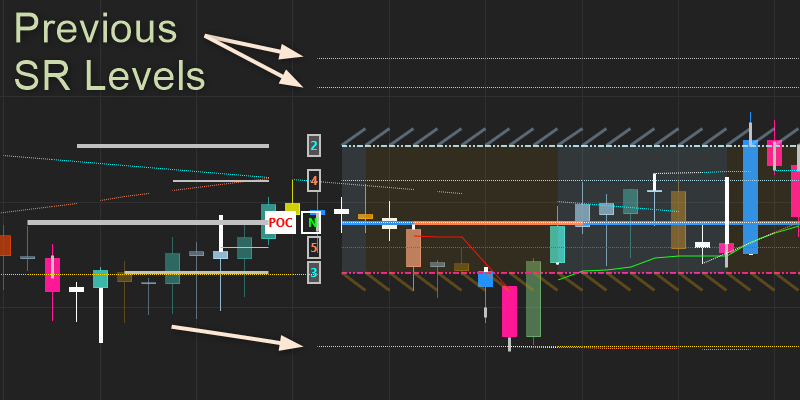
LASR finds 2 Support and 2 Resistance levels outside of the newly forecasted Volume Profile. The Yellow lines represent SR levels derived from Low Volume Nodes and the White lines represent SR Levels derived from previous POC levels ( Strongest level in the Volume Profile. These levels are updated if the market breaks them.
Types of Distributions
The shape of the Volume Profile distribution gives us valuable information on where the big sellers and buyers are in the market. This also show us if there are more support or resistance in the current situation. It can also show shifts in buyer / seller behaviour
More features
Since we have accurately defined and identified a new Volume Profile distribution we can measure some very handy metrics for this new distribution:
Anchored VWAP
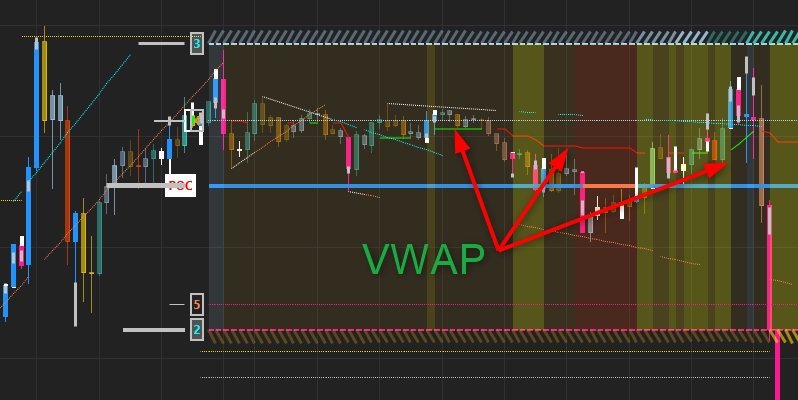
We always wonder when or at which event to anchor and re-anchor our VWAP. It probably makes the most sense to do this when the market “spawns” a new Volume Profile since we now have a forecast of the market`s new range going forward.
Cumulative Delta and Liquidity Zones
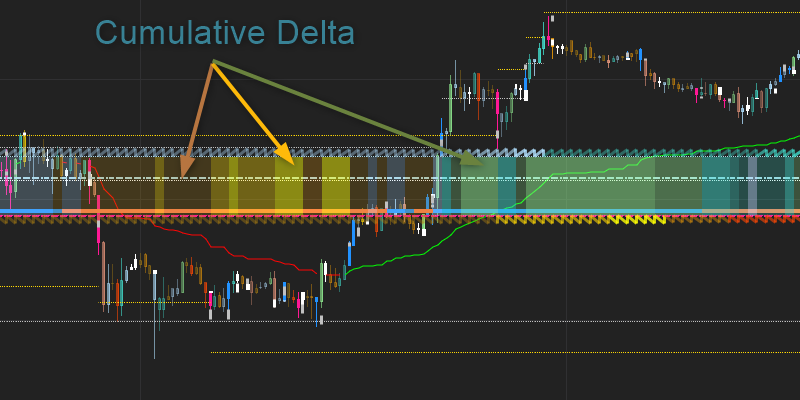
We call the range of this Volume Profile distribution the Liquidity Zone. This is the area where the market is in a accumulation phase before it breaks out to establish a new Volume Profile and Liquidity Zone.
We color the zone with the values from the Cumulative Delta.
We reset the Cumulative Delta calculation when a new Volume / SR profile spawns.
When the Cumulative Delta is positive the Liquidity Zone color changes from Gray to Blue and to Green depending on how high the value of the Cumulative Delta is compare to it`s average and deviation from the past. The colors for negative values goes from Brown to Yellow and Red.
Volume Balance
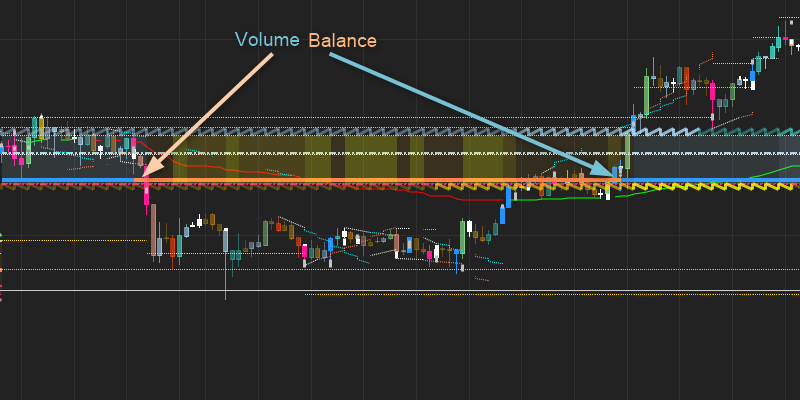
The Cumulative Delta add and subtract the Volume times the Price ( V*P) for every bar whereas the Volume Balance only add and subtract the Volume for each bar.
The Volume balance also resets with each new Volume Profile that spawns.
Volume Balance Significance and Absorption
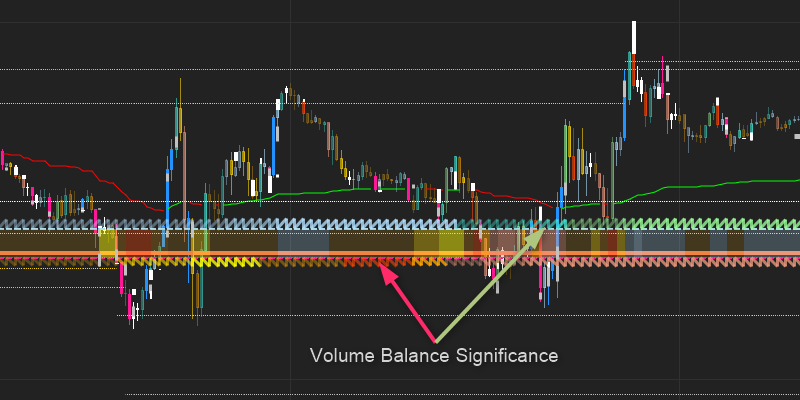
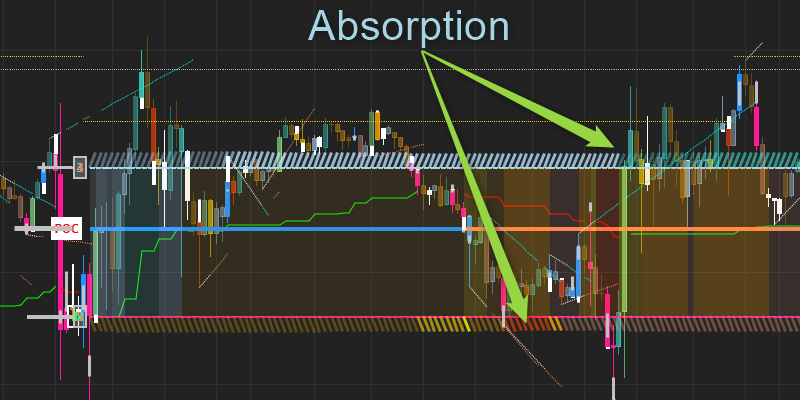
The Volume balance significance measures how strong the volume imbalance is currently compared to previous values. This is based on the average and deviations of past values. The color changes follows the same scheme as the cumulative delta. The greener or redder the colors the more significant the current values are. This shows us how much absorption there has been in this range.
Intra-bar Support and Resistance + Volume Bars
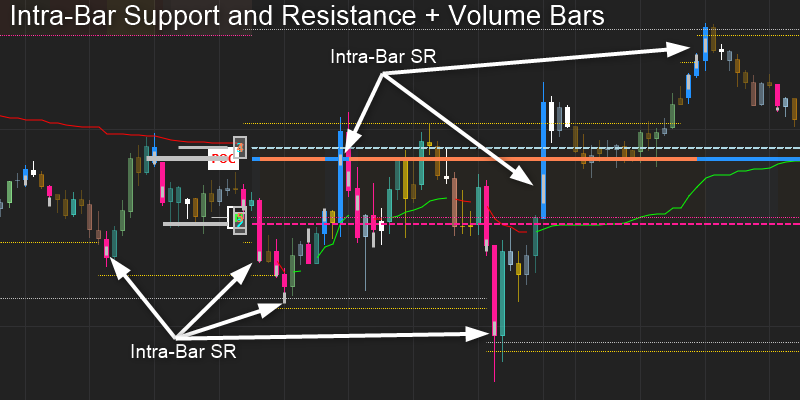
We use Smart Money High Volume bars as the base input for this indicator so it would make sense to reference these bars and compare them to the levels created going forward.
The bars are colored Blue and Pink with a silver line showing the are of the intra-bar support/resistance level. You can see how the market finds volume around our levels. This shows that the levels are accurate and useful. It also validates the level and help us see when a break of the level is valid. These levels are extremely helpful in fine tuning entry and exit levels intra-bar.
The bar colors of the other bars change color according to the amount of ‘heat” experienced in that bar. You can read more on this here.
Auto TrendLines
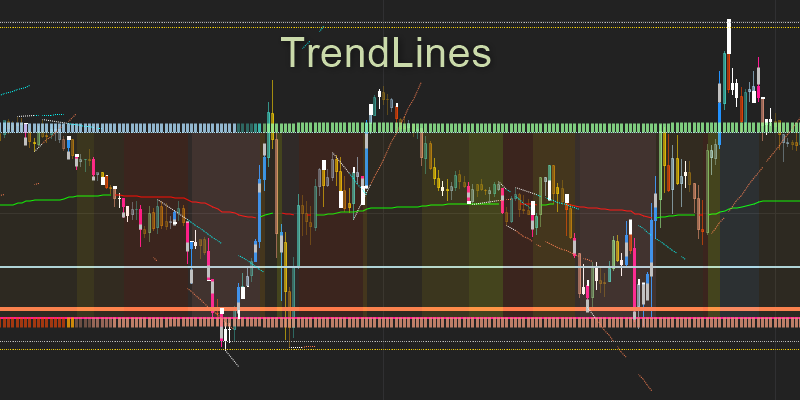
an Analysis of support and resistance is not complete without also looking at trendlines. We draw trendlines here based on the price action around the VWAP. This way all our indicators work together to give us a greater understanding of the market.
Settings and Customisation
All of the features can be customised and turned on or off to reduce the clutter on your charts.
Alerts
We have added alerts to notify you of the following options:
- New Volume Profile spawned
- Cumulative Delta change Up or Down
- Volume balance change Up or down
These alerts are configurable to say what you want it to say. Example “VWAP change to Up” or ” New Volume Profile spawned”