Q-Better Bollinger NT8
  1. Home
  2. /
  3. downloads
  4. /
  5. Q-Better Bollinger NT8

Q-Better Bollinger NT8

Our Better Bollinger indicator is a free indicator for all Ninjatrader users.

Bollinger Bands is an effective and very popular indicator based on a moving average and a volatility measure above and below the average.

Indicators based on moving averages generally suffers from tardiness. Being slow does not help anyone get anywhere fast, especially our trading success.

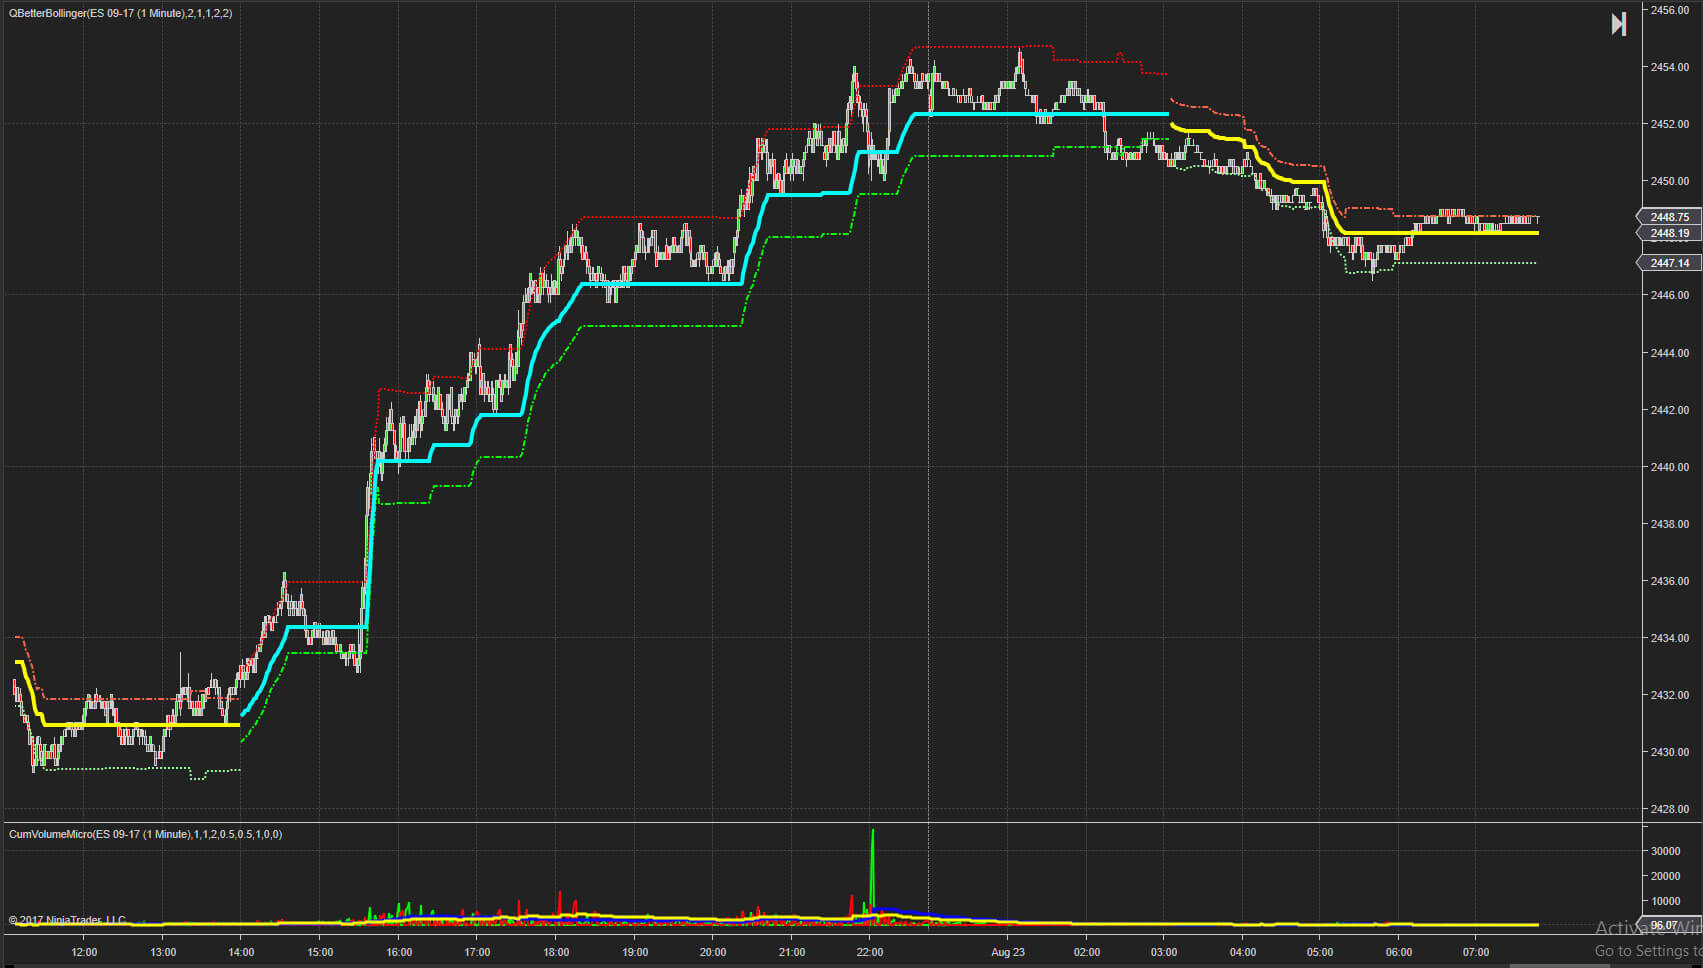
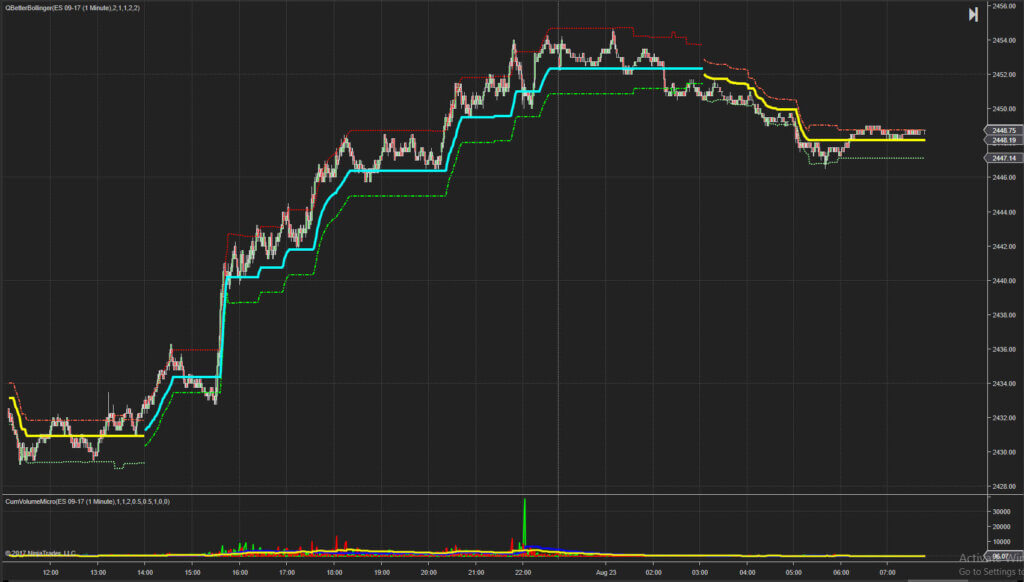
Our Better-Bollinger Indicator succeeds in this goal by replacing the moving average with our Proprietary smoothing algorithm and replacing the volatility forecast with our Proprietary volatility forecasting model.

Effective smoothing removes most of the whipsaw associated with averages and trend-following indicators without slowing it down too much.
Effectively forecasting the volatility allows for better range forecasts. Using a measure of the past average for this goal leaves our indicator lagging behind.

Combining the above allows us to also accurately detect trend changes.

So , we have an indicator that detect trend changes fast and accurately , we remove the noise and whipsaw effect and we have a very accurate volatility forecast that adapts fast and efficiently to changing market conditions.
Better Bollinger

For more products, visit our indicator page here: https://quaderr.com/indicators/

MORE PRODUCTS YOU MAY LIKE

We pick out some of our products

QTL

Introduction to QTL Trendlines must be the staple of every trader`s diet. The problem is that trendlines can be drawn in so many incorrect ways. Drawing it incorrectly can make every trade a loser and vice versa, getting it right makes all the difference! QTL is a much faster and a far more accurate approach […]
$340.00

Q-Volatility

Q-Volatility is our Free Ninjatrader Indicator. How is Market Volatility measured? Market volatility is measured by finding the standard deviation of price changes over a period of time. The statistical concept of a standard deviation allows you to see how much something differs from an average value. Browse our other free indicators here: https://quaderr.com/free-indicators/ Free – Add to Cart […]

CBO Patterns

CBO Patterns – Probability‑Driven Chart Pattern Recognition CBO Patterns is the next evolution of our CBO Indicator. It doesn’t just highlight breakout zones — it identifies the chart pattern forming inside each consolidation, calculates probabilities for long and short moves, and projects realistic profit targets based on historical support/resistance. With CBO Patterns, you trade with […]
$450.00

Q-Fibonacci Extensions NT8

If you like Fibonacci Extensions and see the potential in it`s ratios you will like our suite of Fibonacci indicators. First we use our algorithm to detect trend changes to determine the pivots. Once a trend is signalled the Fibonacci levels are drawn relative to the current and past trends. This is a free indicator […]

Q-Next NT8

Q-Next  accurately detects trend changes and estimate the Next support or resistance level as the trend develops. As a resistance level gets broken it finds the next resistance level higher. Vice Versa for down trends. When a trend is perceived to be failing it adjusts the support or resistance against the trend. Q-Next adjust to: Periods of […]
ADDED TO CART