Q-Cumulative Delta

  1. Home
  2. /
  3. downloads
  4. /
  5. Q-Cumulative Delta

Q-Cumulative Delta

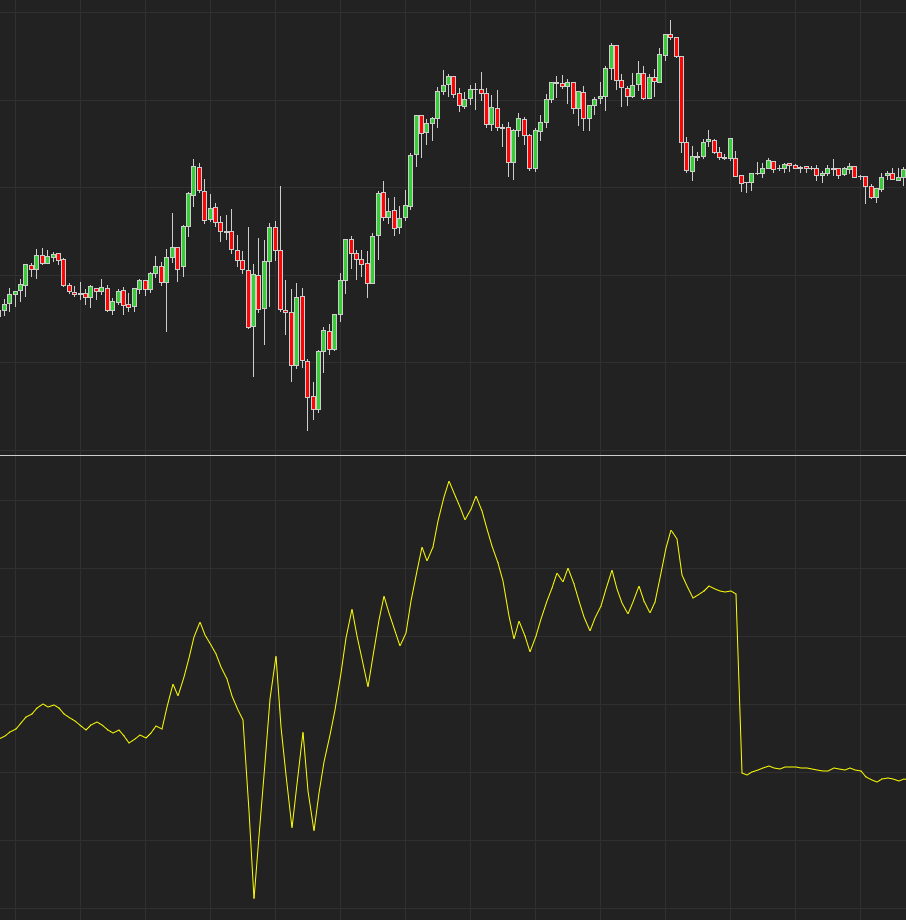
Cumulative Delta is a metric used in trading to analyze market dynamics by tracking the net difference between buying and selling volumes over a specific timeframe. It offers traders a window into the prevailing buying or selling pressure, revealing insights into price movement dynamics influenced by supply and demand shifts.

The cumulative delta indicator is a technical analysis tool that tracks net buying or selling pressure in particular markets. It’s calculated by comparing volume of trades at different price levels and is used to identify market trends and opportunities.

Browse our other free Ninjatrader indicators here: https://quaderr.com/free-indicators/

MORE PRODUCTS YOU MAY LIKE

We pick out some of our products

Q – Profiler

Smarter Volume Profile & Trend Detection for Professional Traders. The Q-Profiler Indicator combines the power of Volume Profile with dynamic trend analysis, support, and resistance — giving traders a smarter way to see where the market truly values price. What makes it different? Traditional volume profiles simply stack raw volume at each price level. That’s […]
$540.00

Q-Volatility

Q-Volatility is our Free Ninjatrader Indicator. How is Market Volatility measured? Market volatility is measured by finding the standard deviation of price changes over a period of time. The statistical concept of a standard deviation allows you to see how much something differs from an average value. Browse our other free indicators here: https://quaderr.com/free-indicators/ Free – Add to Cart […]

Money Flow

Follow the Smart Money with Money Flow – a product developed for the Ninjatrader platform Ever tried to make sense of the stock market? It’s like searching for a clear melody in a noisy crowd. But guess what? We’ve cracked a code that helps us find the real tune. Our Money Flow indicator use two […]
$340.00

Q-Trendiness

Trendiness: Our free Trend following Ninjatrader Indicator. Trend-following indicators are technical tools that measure the direction and strength of trends in the chosen time frame. Some trend-following indicators are placed directly on the price panel, issuing a bearish signal when positioned above price and a bullish signal when situated below price. Browse all our free indicators […]

Q-SuperTrend NT8

Q-SuperTrend aims to find the Major trend and  then plot a curve along the most probable trajectory of the trend. This is a free indicator for all Ninjatrader users. It also plots dots for Major Turning Points – These Turning Points displays areas of future support and resistance . Please note these plots are plotted in […]
ADDED TO CART