Q-Volatility

  1. Home
  2. /
  3. downloads
  4. /
  5. Q-Volatility

Q-Volatility

Q-Volatility is our Free Ninjatrader Indicator.

How is Market Volatility measured?

Market volatility is measured by finding the standard deviation of price changes over a period of time. The statistical concept of a standard deviation allows you to see how much something differs from an average value.
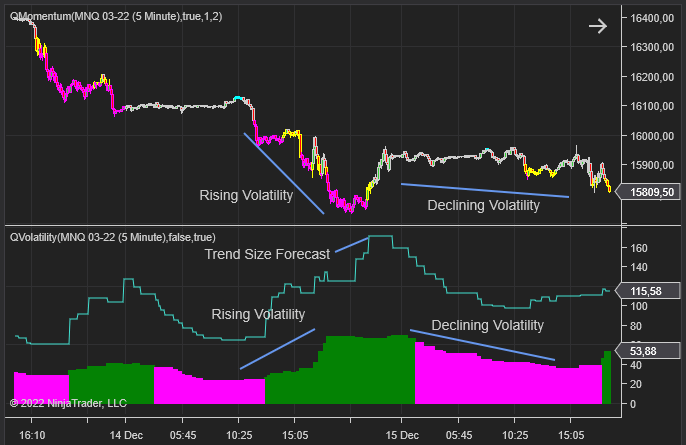
Q-Volatility

Browse our other free indicators here: https://quaderr.com/free-indicators/

MORE PRODUCTS YOU MAY LIKE

We pick out some of our products

Quaderr Strategy Builder

Create – Test – Deploy – Analyze. In professional trading, strategy execution demands more than raw indicators—it requires systems designed around flexibility, accuracy, and control. The Quaderr Strategy Builder was born out of a need to consolidate years of experimentation into a single, user-configurable framework. No Code, Full Control The Quaderr Strategy Builder eliminates the […]
$1,500.00

Market Structure SR

Market Structure SR: Volume Profile ,Precision Support & Resistance for Smarter Trades With this indicator we took all of the great features of our Market Structure indicator and added Support and Resistance levels to it. The SR levels are derived from previous Point of Controls, High Volume and Low Volume Nodes. The SR levels are […]
$440.00

QTL

Introduction to QTL Trendlines must be the staple of every trader`s diet. The problem is that trendlines can be drawn in so many incorrect ways. Drawing it incorrectly can make every trade a loser and vice versa, getting it right makes all the difference! QTL is a much faster and a far more accurate approach […]
$340.00

Q-Bars

This indicator combines all of the great features of our Heat and Smart Bars indicators. Smart Bars analyses the interest ( Volume and other variables) to show us areas of support and resistance as well as areas of No interest. These are levels where the interest dries up, Kind of the calm before the storm. […]
$495.00

Q-Momentum

The purpose of Q-Momentum is to detect when the market increases or decreases momentum. Momentum simply explains when the market starts trending stronger in its current trend. We like to use this Ninjatrader indicator to help with determining good exit levels for profit targets. For more info, visit the page here: https://quaderr.com/q-momentum/
$290.00
ADDED TO CART