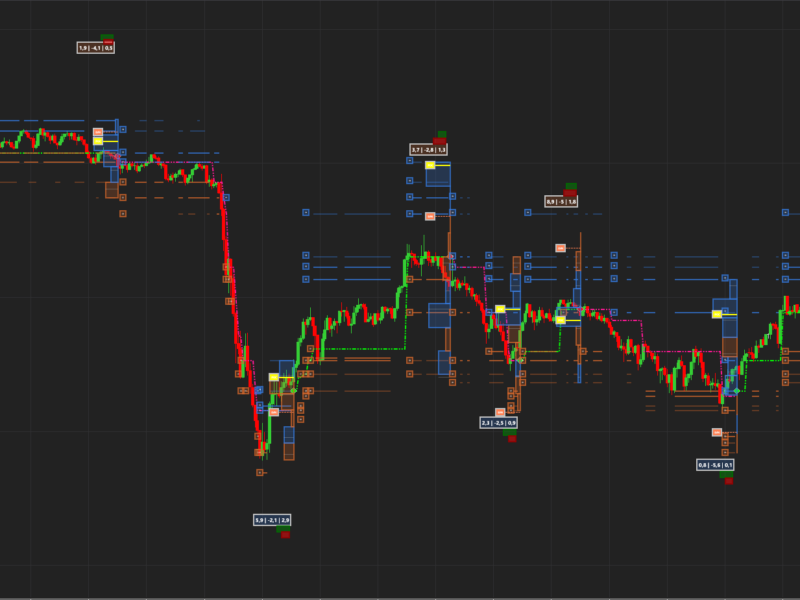
Smarter Volume Profile & Trend Detection for Professional Traders.
The Q-Profiler Indicator combines the power of Volume Profile with dynamic trend analysis, support, and resistance — giving traders a smarter way to see where the market truly values price.
What makes it different?
Traditional volume profiles simply stack raw volume at each price level. That’s useful, but it doesn’t tell you who is trading or how the market is behaving. We’ve taken a new approach:
- Smart Money Filter: Our algorithm separates institutional‑grade “smart money” volume from the rest, so you see where the real market movers are active.
- Three Pillars of Heat: We combine smart volume, delta (buy vs. sell pressure), and volatility into a single Heat Value. This creates a profile that reflects the true activity.
- Delta Value: We calculate the net delta at each level and color code the bins accordingly
We call this a Heat Profile — a more intelligent version of volume profile.
Adaptive Trend Profiles
The indicator doesn’t just plot static distributions. It learns from each profile:
- It starts by defining an initial trend.
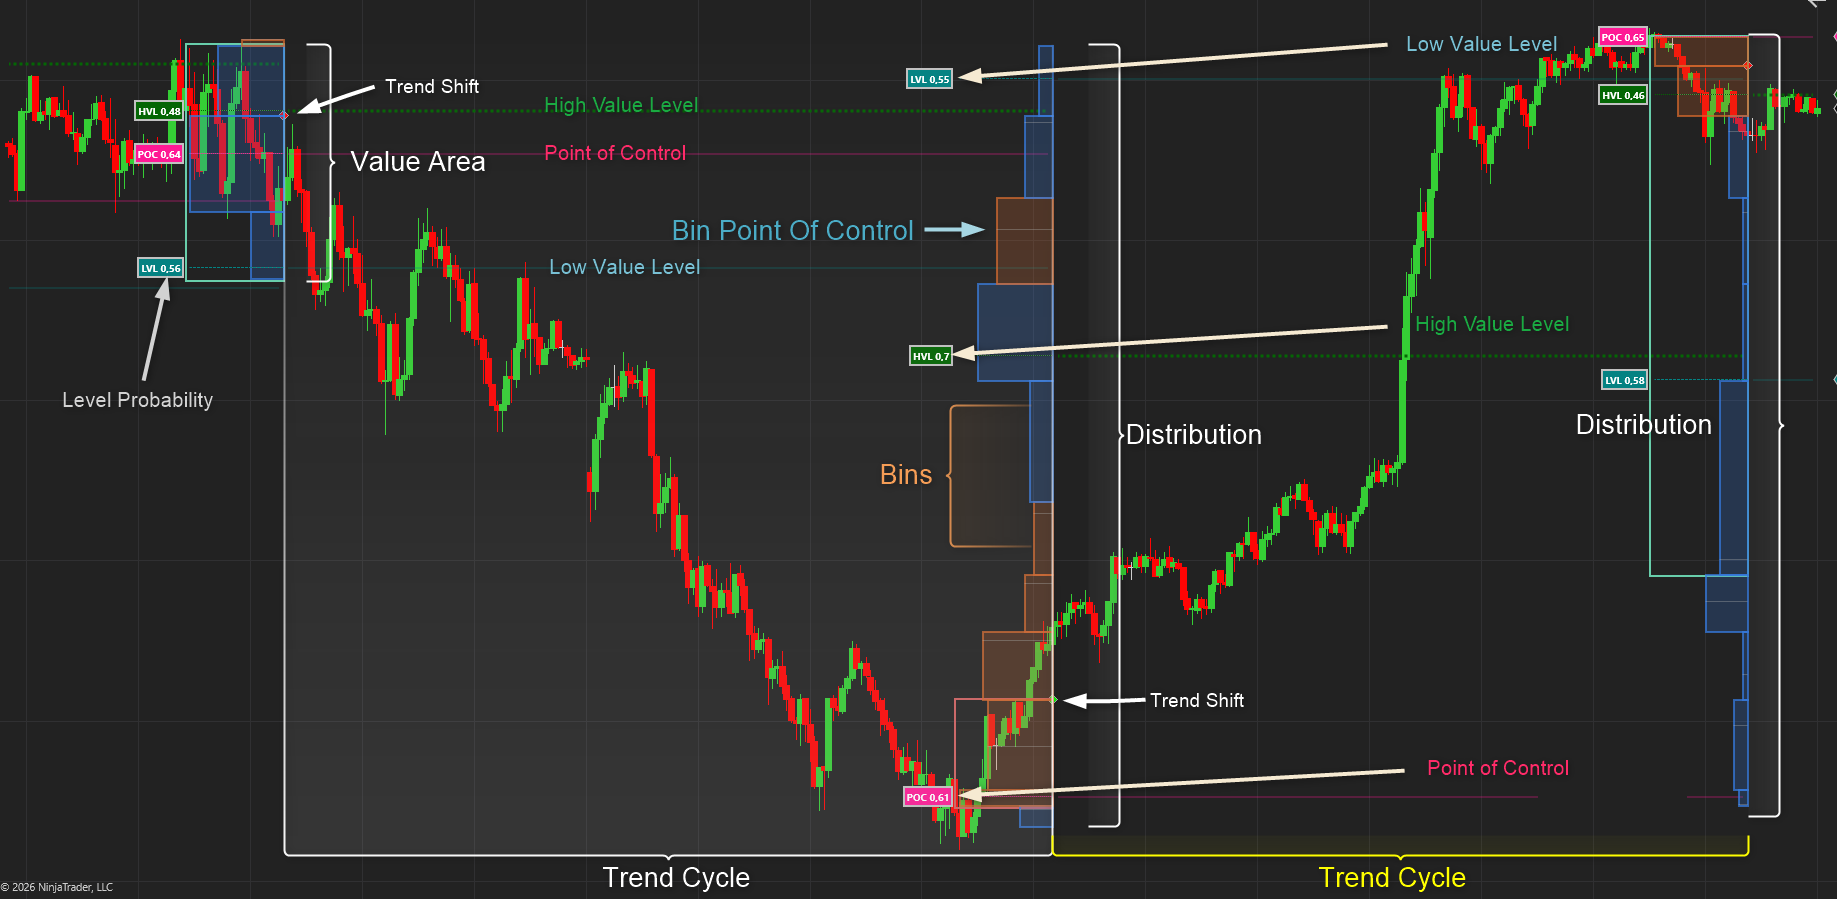
- When the trend changes, the profile resets. Calculates the Point of Control ( POC ) and Low Heat Level ( LHL ) , the High heat Level ( HHL ) and the Value Area ( VA )
- Each reset incorporates what was learned from the last Heat Profile — determining Support and Resistance levels , refining trend detection and improving accuracy over time with the inputs from the POC, LHL, HHL and VA.
This creates a feedback loop: every profile teaches the indicator more about how the market is behaving, so your trend analysis gets sharper with each shift.
Adaptive Support & Resistance
The Heat Profile doesn’t just highlight value areas — it extracts precise support and resistance levels from the distribution of smart money volume, delta, and volatility.
Dynamic Lifecycle of Levels
- Derived from Heat Profiles: Each profile generates S/R levels based on where institutional activity concentrated.
- Saved while relevant: These levels remain active on your chart as long as the market respects them.
- Removed when invalidated: Once price action proves a level is no longer significant, it is automatically cleared. This keeps your chart clean and focused only on relevant zones.
Feeding Back into Trend Discovery
- Every time a trend shift occurs, the Heat Profile resets.
- The S/R levels from the prior profile are evaluated: those still respected are retained, those broken are discarded.
- The surviving levels are fed back into the trend engine, sharpening its ability to detect and confirm new directional moves.
- This creates a continuous learning loop.
Heat Profile Explained
Key to Q-Profiler
Calculation Methods
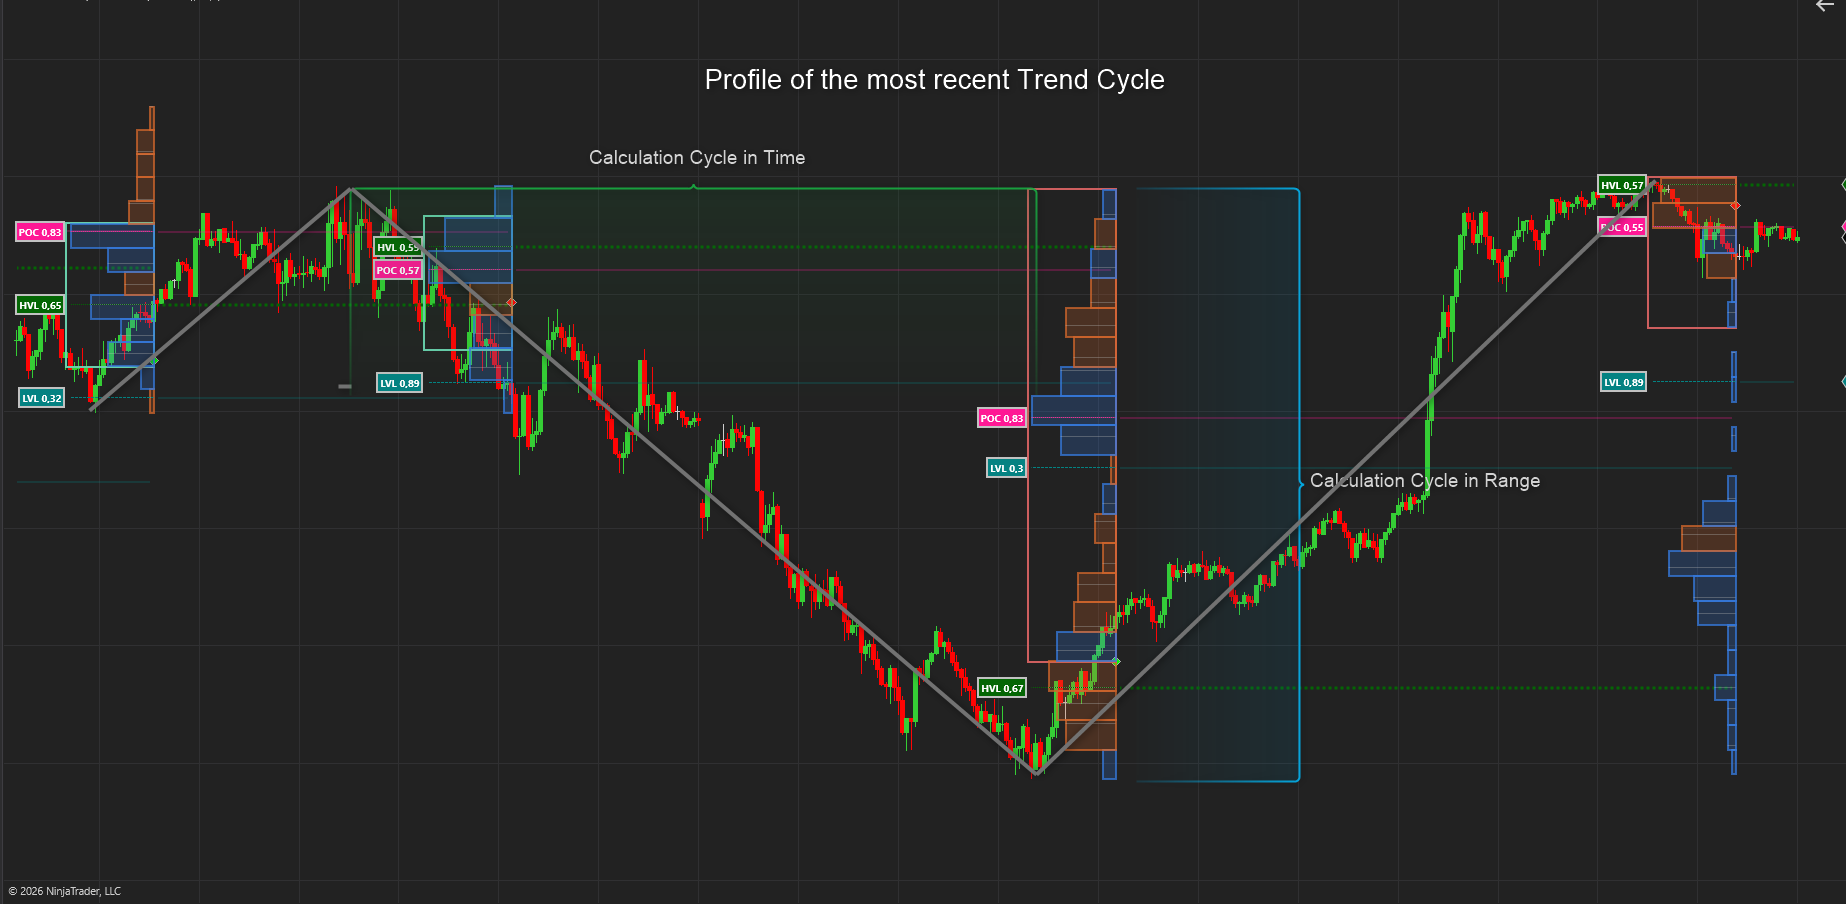
When calculating a Volume (Heat Profile) we need to define the range and time period over which to calculate. In general we do this over the current session or a fixed number of bars. This tool goes a step further by allowing you to calculate not over a fixed period or session only but also:
- Over a user defined number of trade cycles in terms of there length in time (bars) . From 1 – 8 cycles.
- The range (High to Low) of any number of cycles. From 1 – 8 cycles.
- Thus you can calculate over say the range of 8 cycles and the number of bars of 2 cycles. This way you can accurately define the window to calculate.
Bins
We also need to define the number of bins to divide the range in to. The number of bins are very important as it can change the estimation of the High Value Level, Low value Level and Point of control significantly.
Below we divide the range by 1 ATR , Thus we a use non – arbitrary number of bins. If the range = 50 ATR , then we will have 50 bins etc.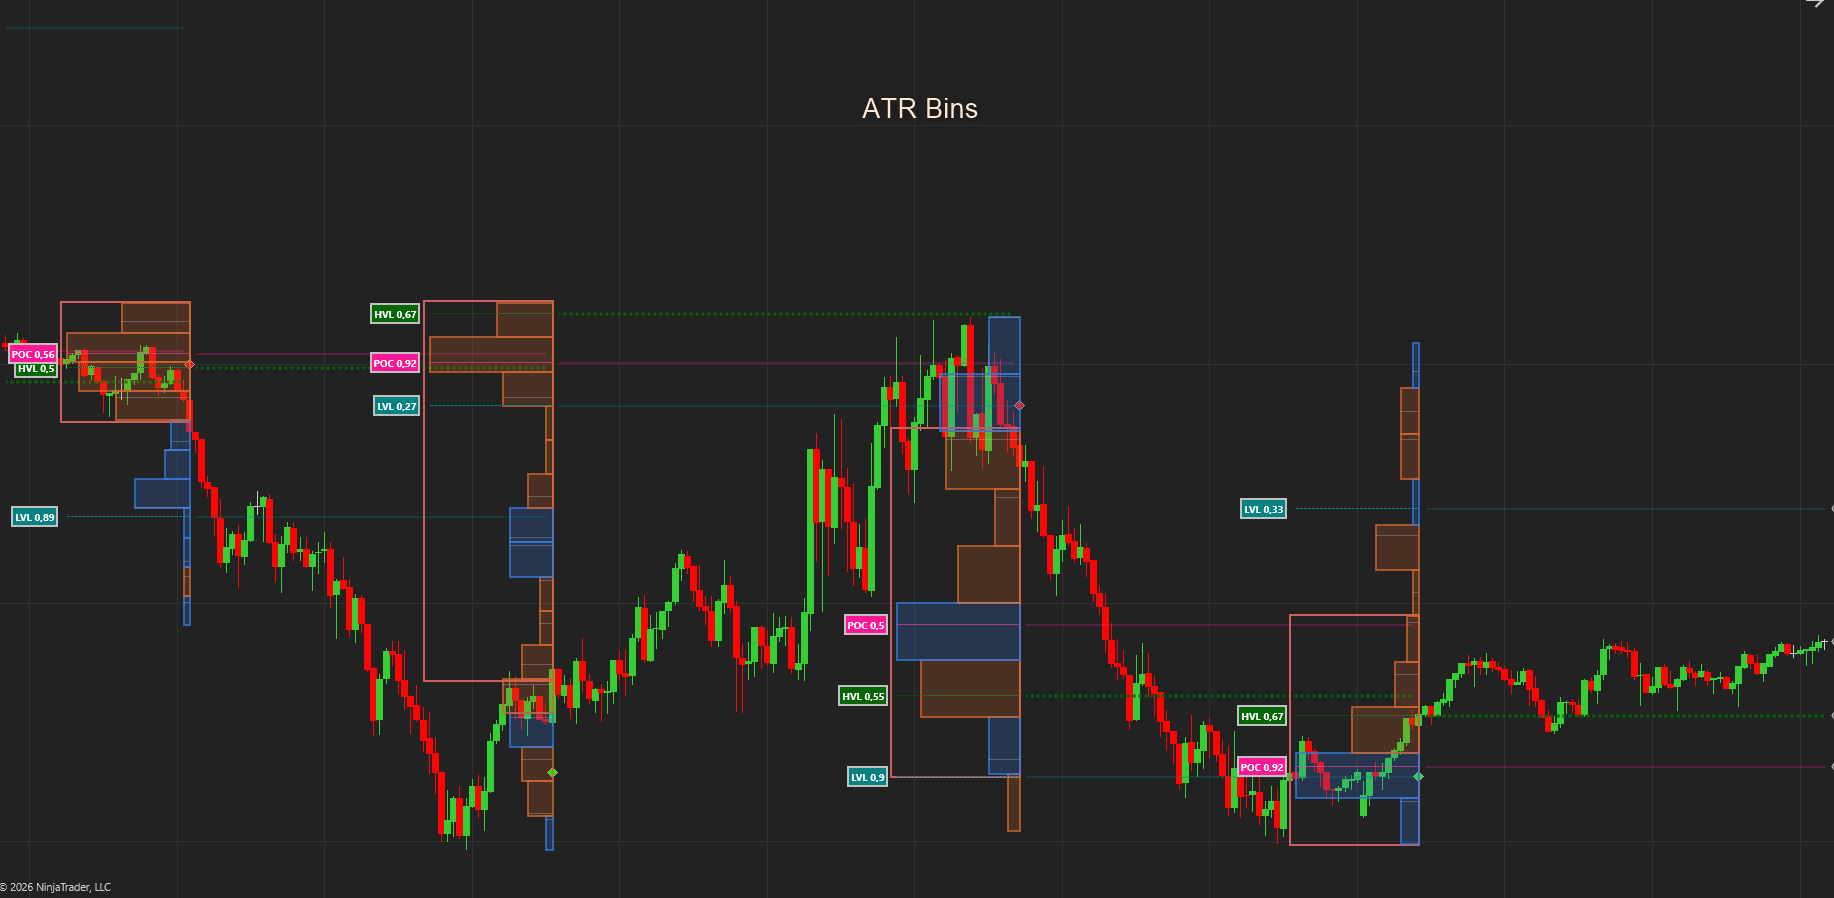
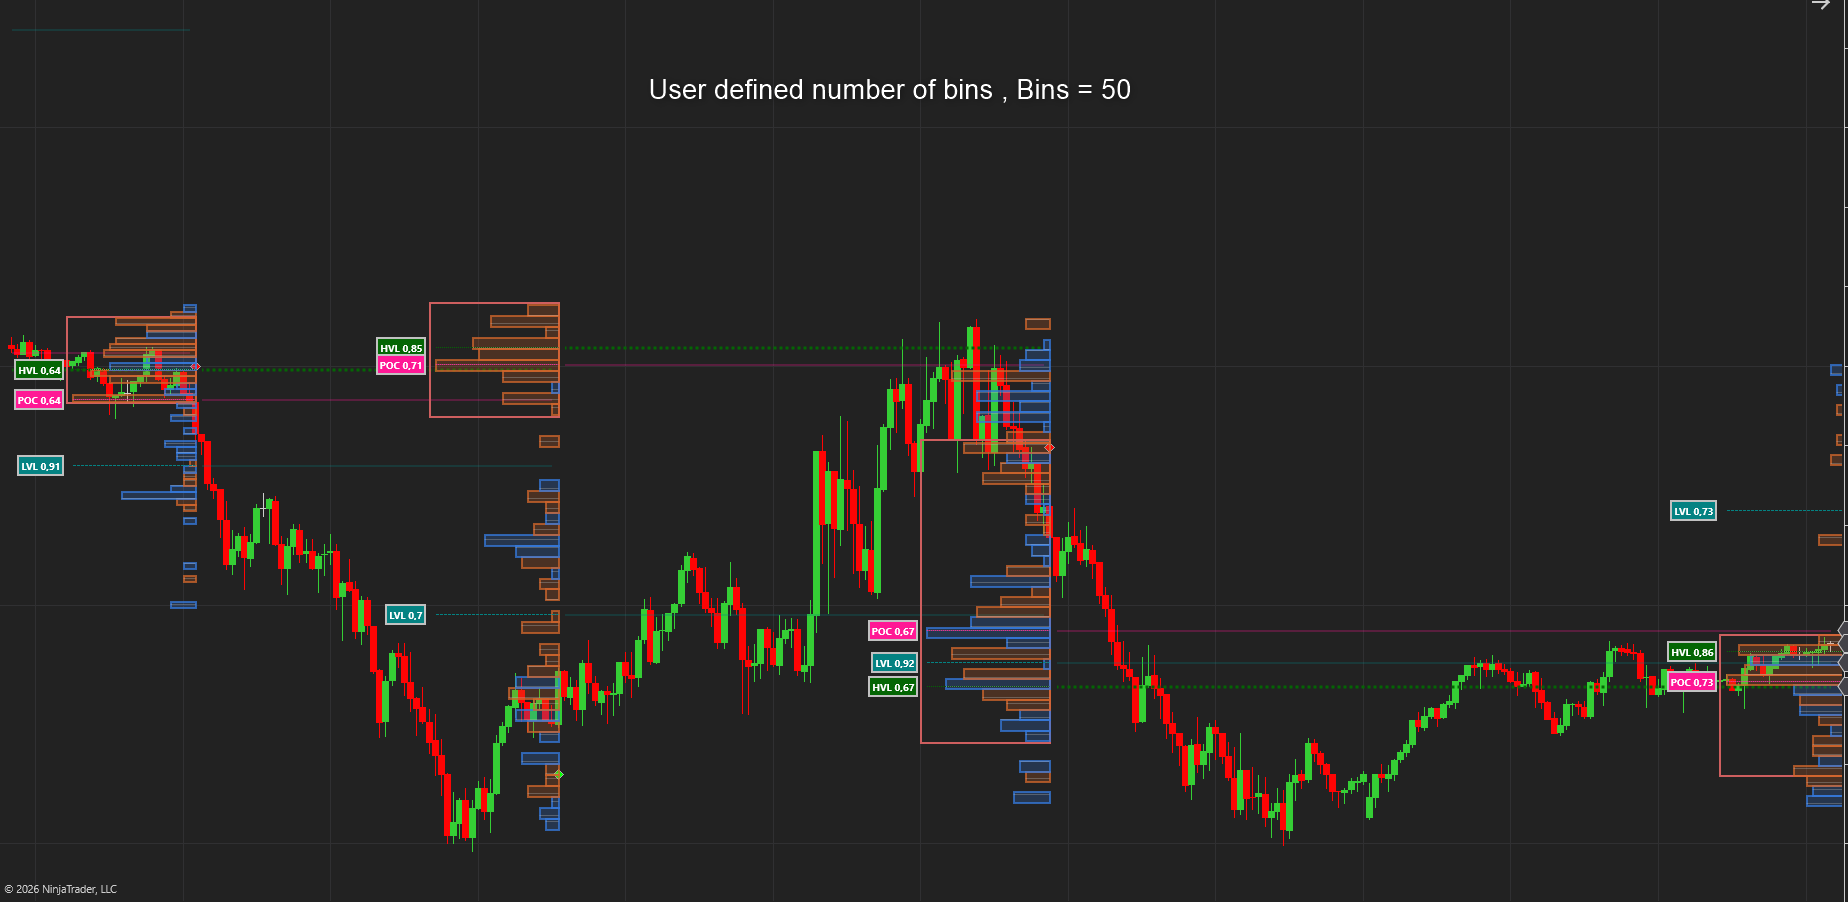
Below we manually set the number of bins to 50: As you can see setting it to ATR far improves the calculation in terms of trend changes and level identification.
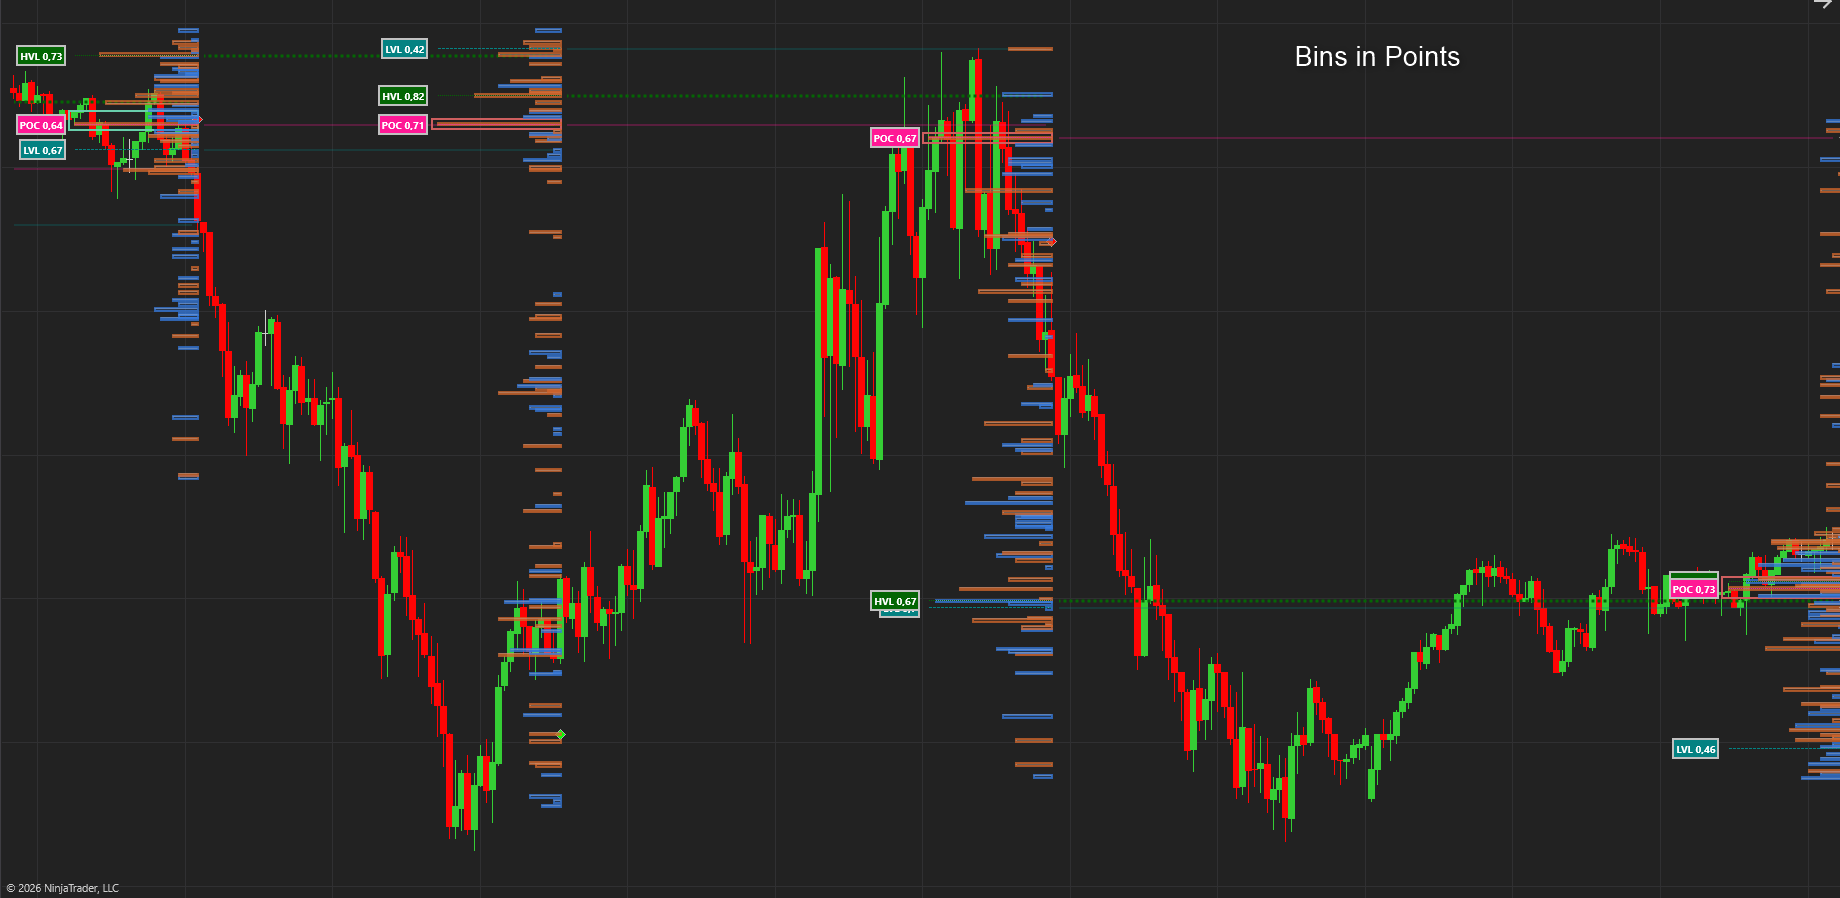
Here we create the number of bins in terms of points. Thus 1 bin per 1 Point.
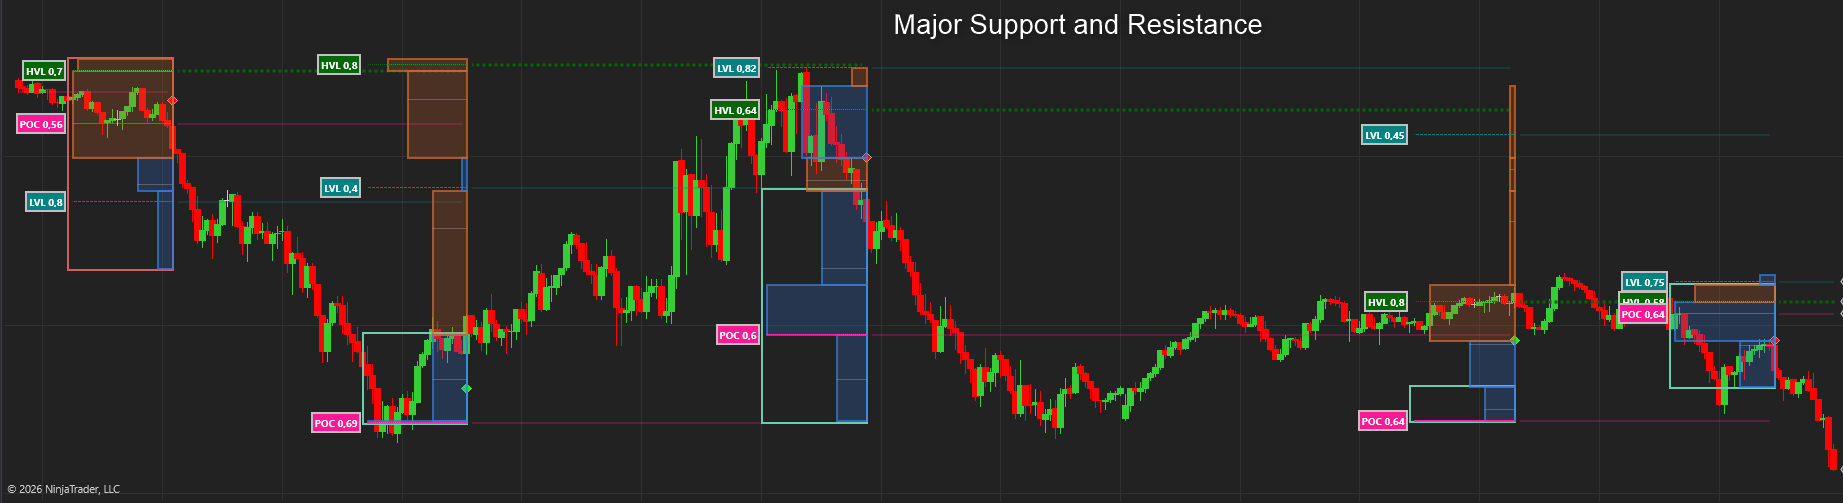
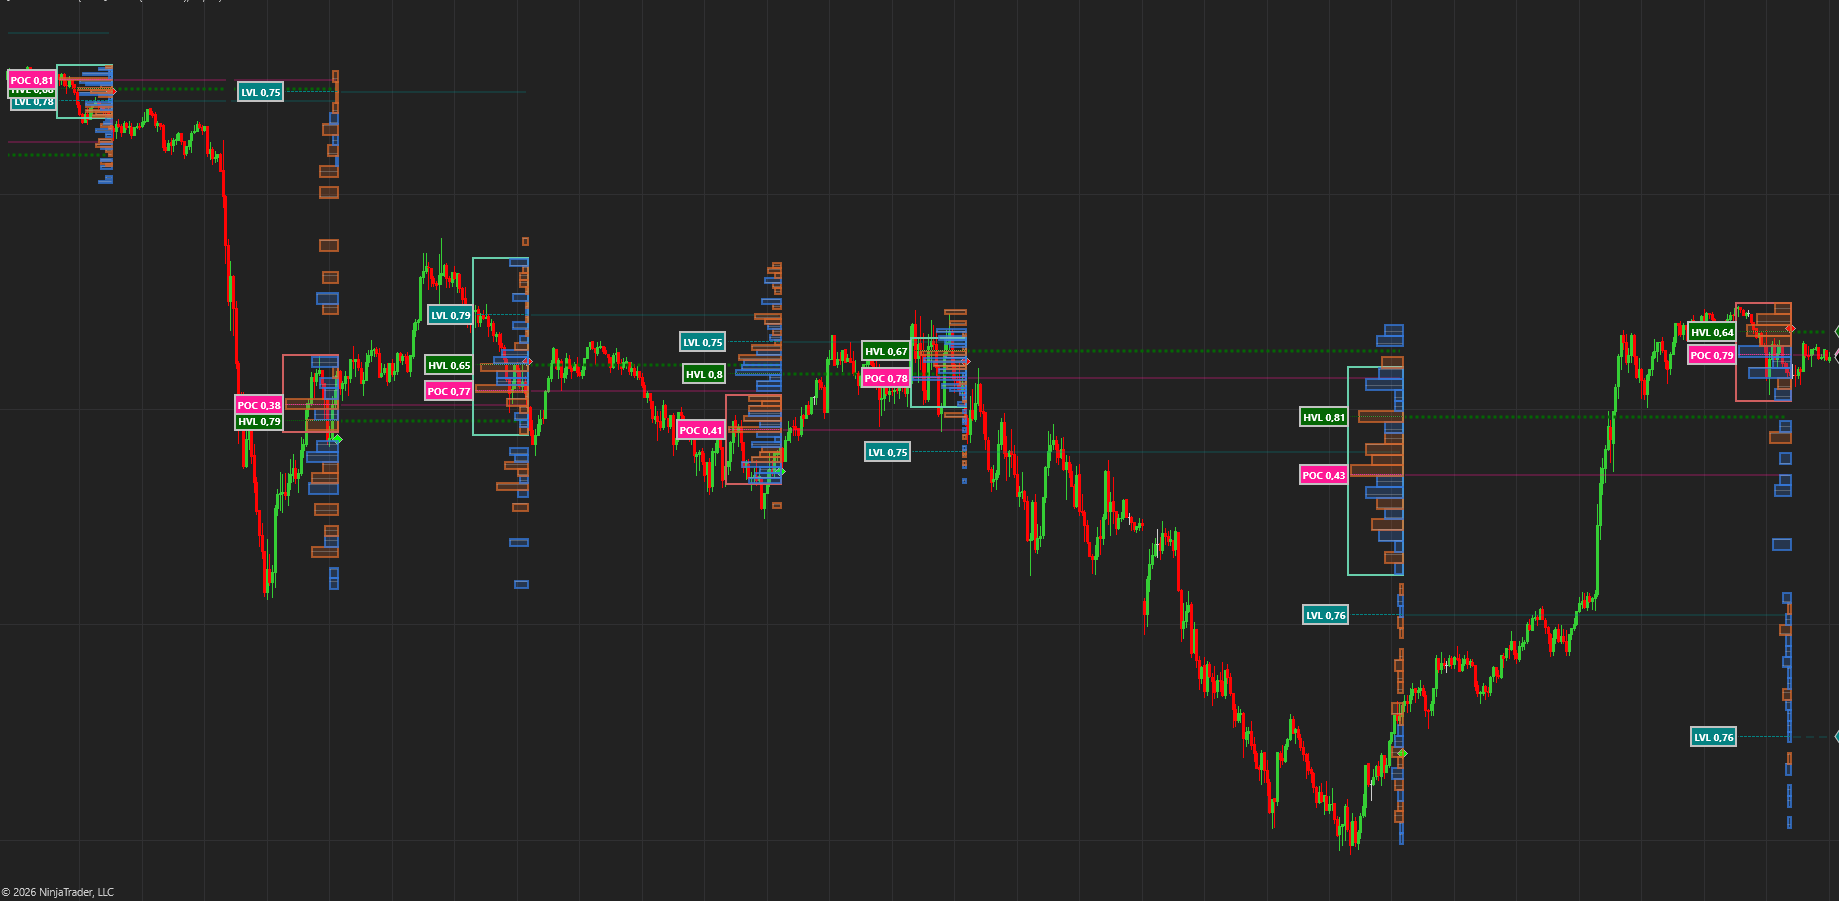
Below we define the number of bins by all the Significant Support and Resistance levels that were relevant during the period under review. We now have a smart way to define the Bins instead of just choosing an arbitrary number of bins our determination of the POC, HVL and LVL are far more accurate! These bins now represent SR levels and Heat zones that are very significant in the future.
Bin Point of Control
We also define the Point of Control inside each bin that helps to pin-point the exact support/resistance level inside each bin.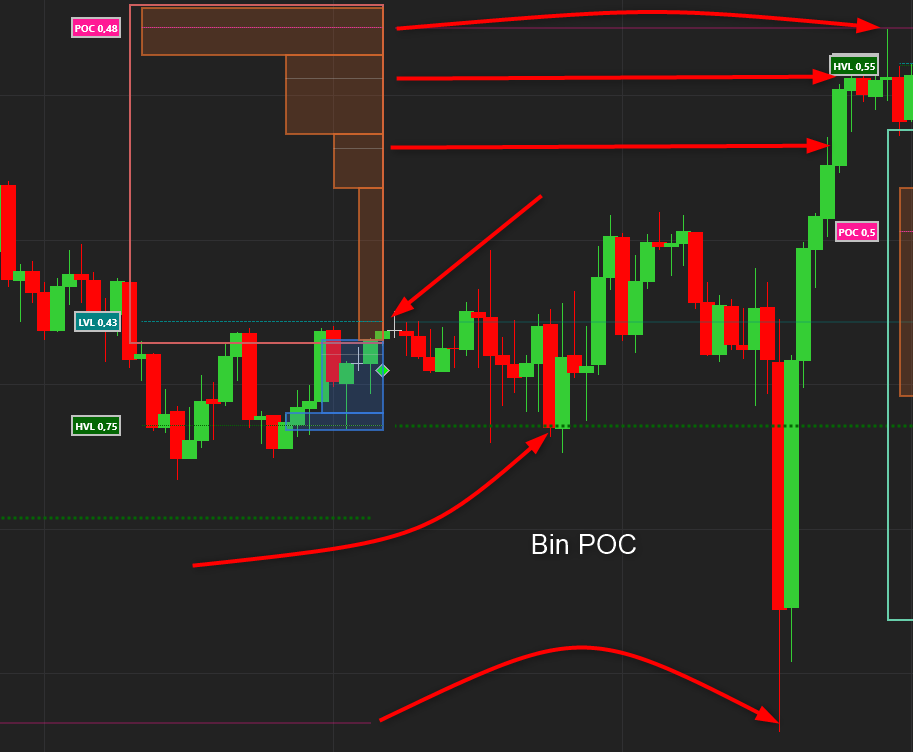
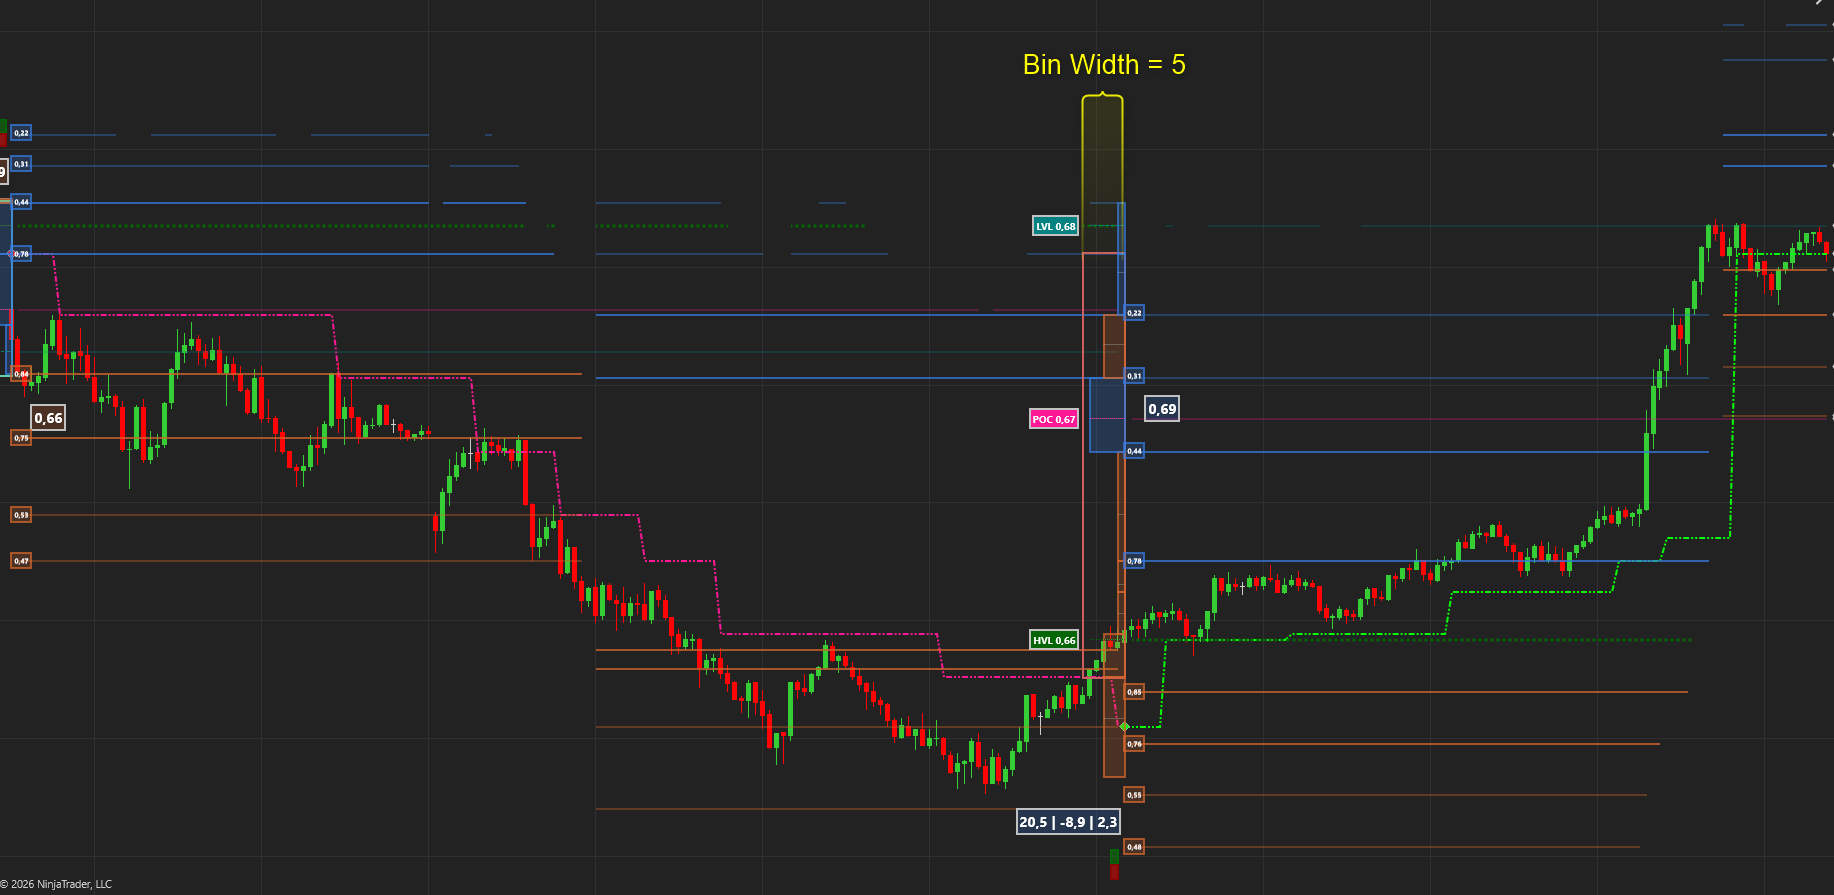
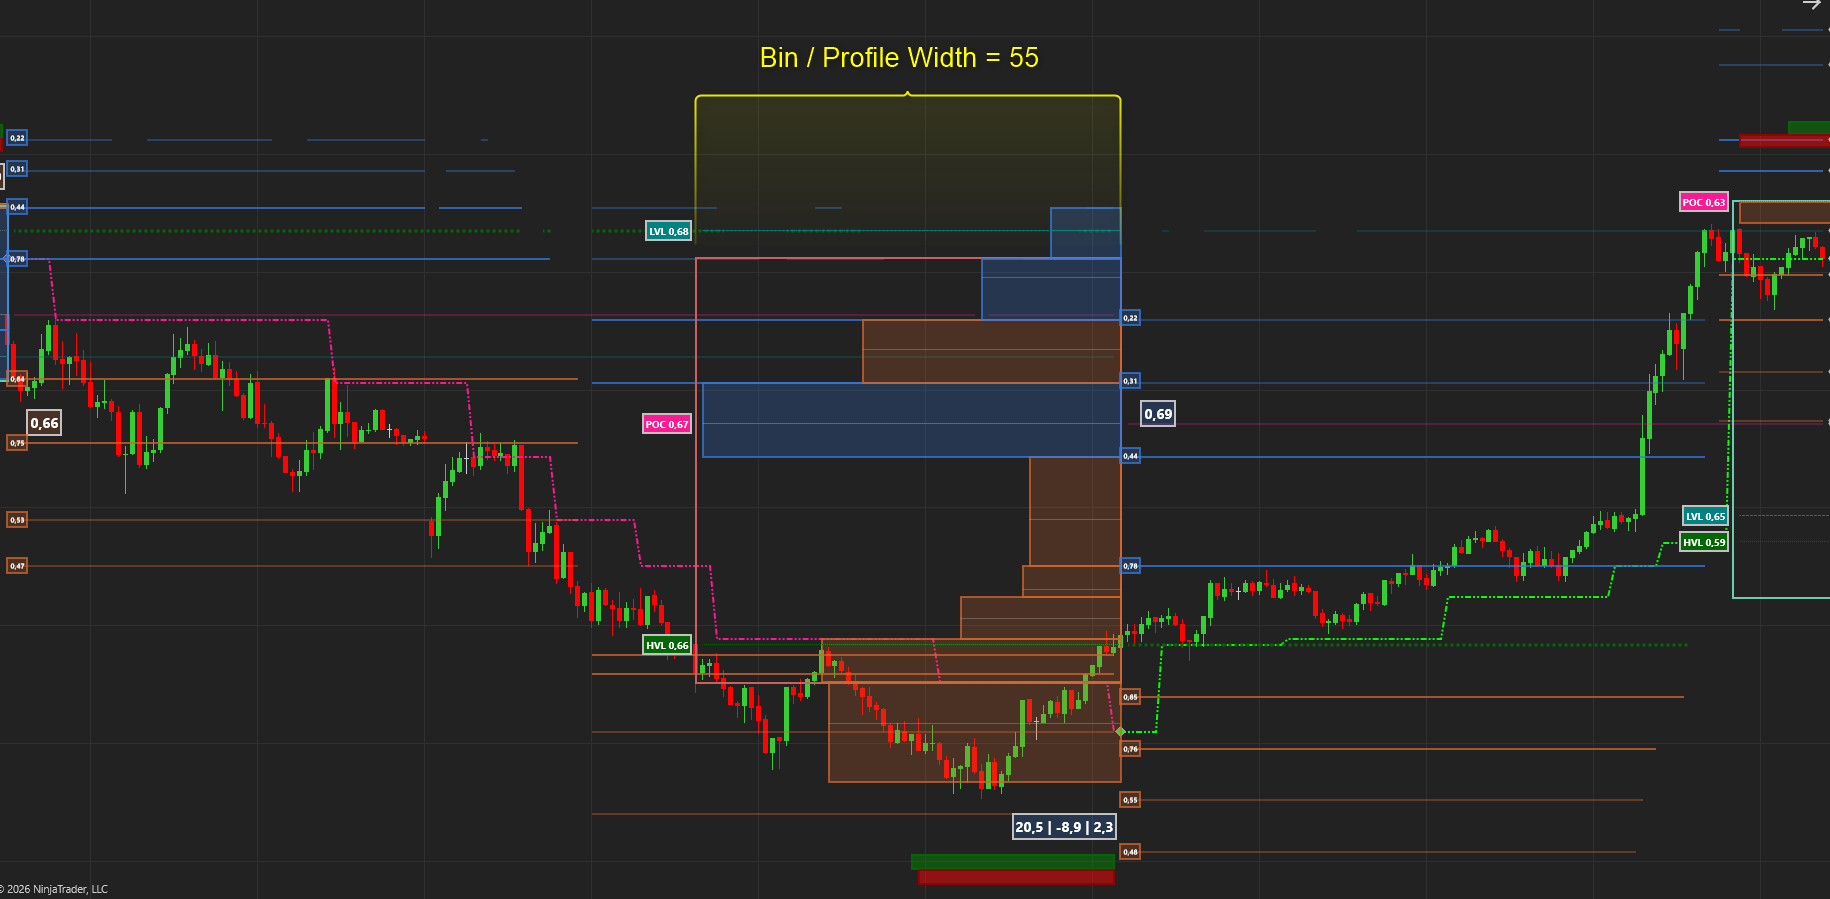
As these bins / profiles can overlap and make your charts seem cluttered we have added a setting to determine how wide the bins plot in terms of number of bars. You can make them 5 bars big or larger.
*** The Bin Color is determined by the Delta of each bin.
Profile Inputs
Traditionally we input Volume or Delta to calculate a Volume profile but we have found that using our Heat calculation produces far superior results as it it not only looks at absolute volume but rather a combination of Smart Volume, Smart Delta and Volatility. That said we give you the option to use the following inputs:
- Heat (Smart Volume, Delta, Volatility and more)
- Smart Delta ( Buyers vs. Sellers )
- Smart Volume
- No Interest ( Rejection levels)
- Volume
- Standardized Volume ( Volume / Deviation)
- Time ( Simply counts how many times the price was at this level)
Profile with Volume and Number of Bins ( Standard method )
Profile with Heat and SR Bins
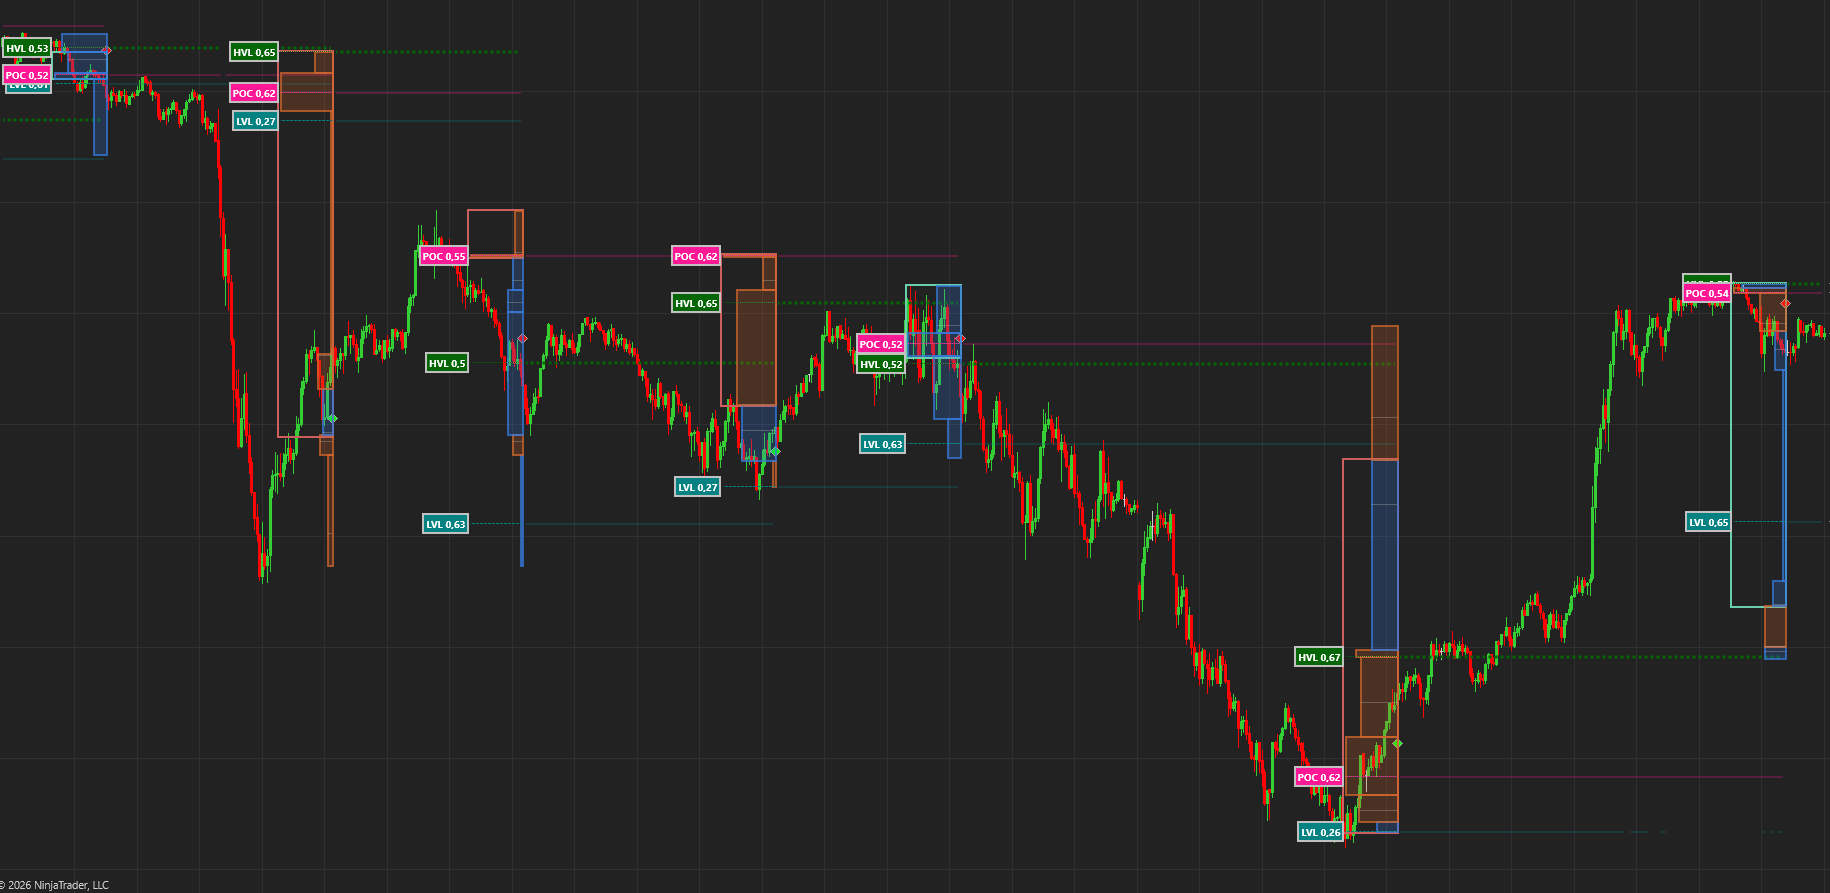
Profile with Heat and ATR Bins
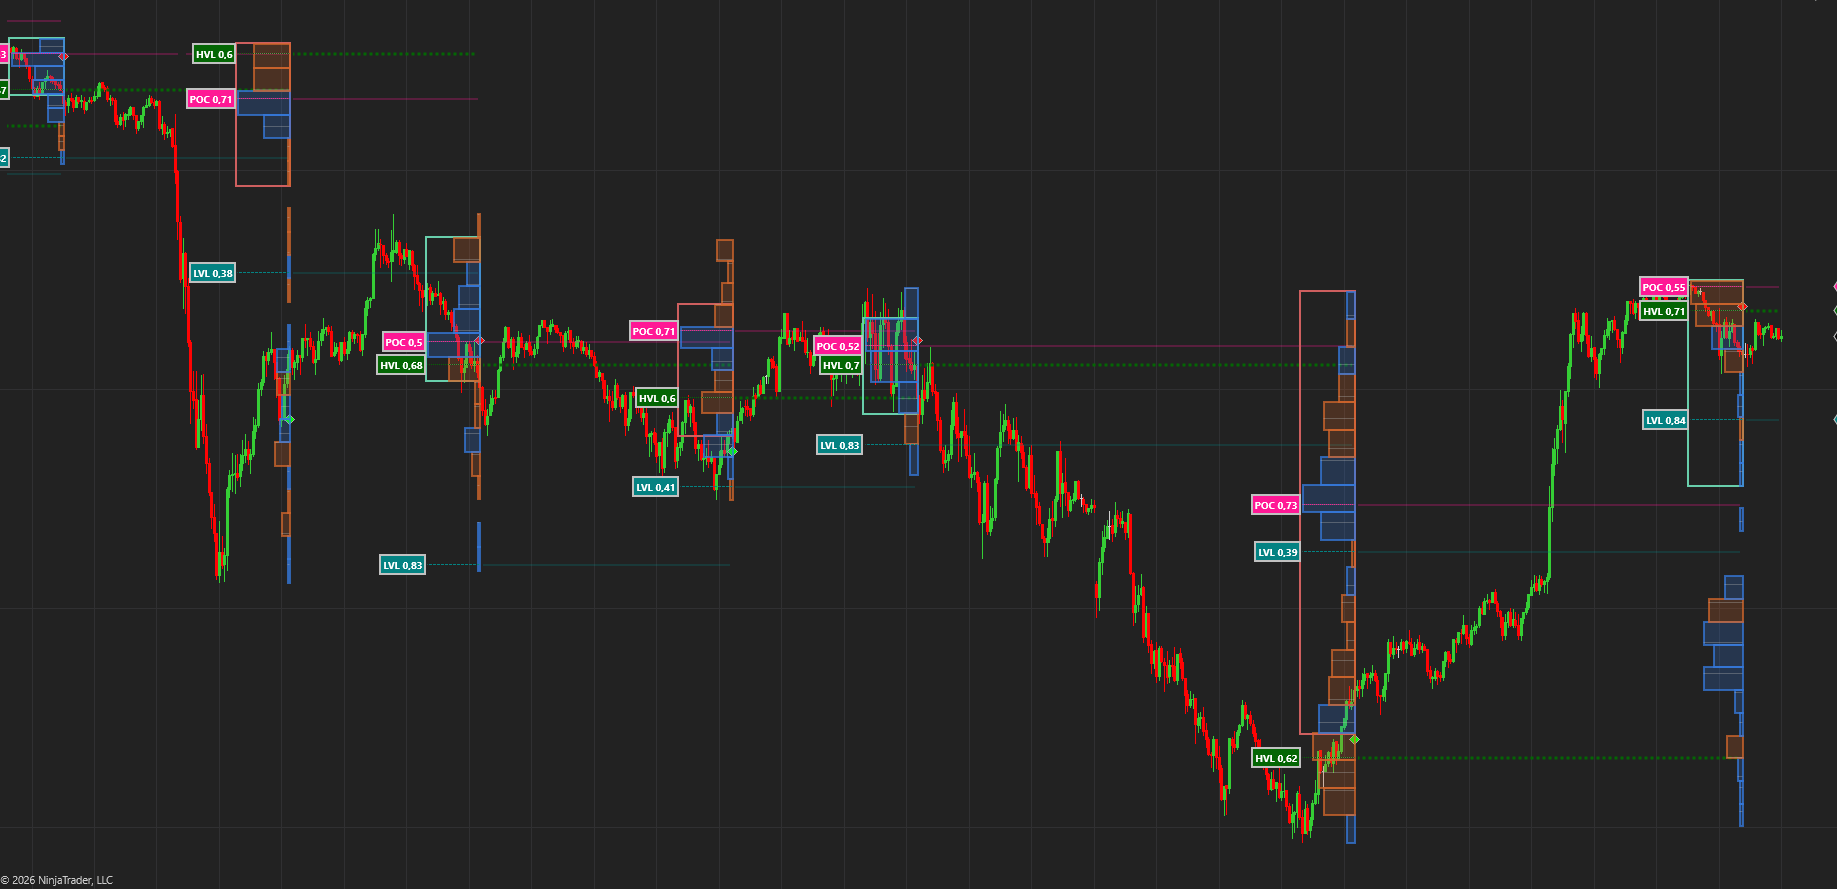
Profile Level Probability
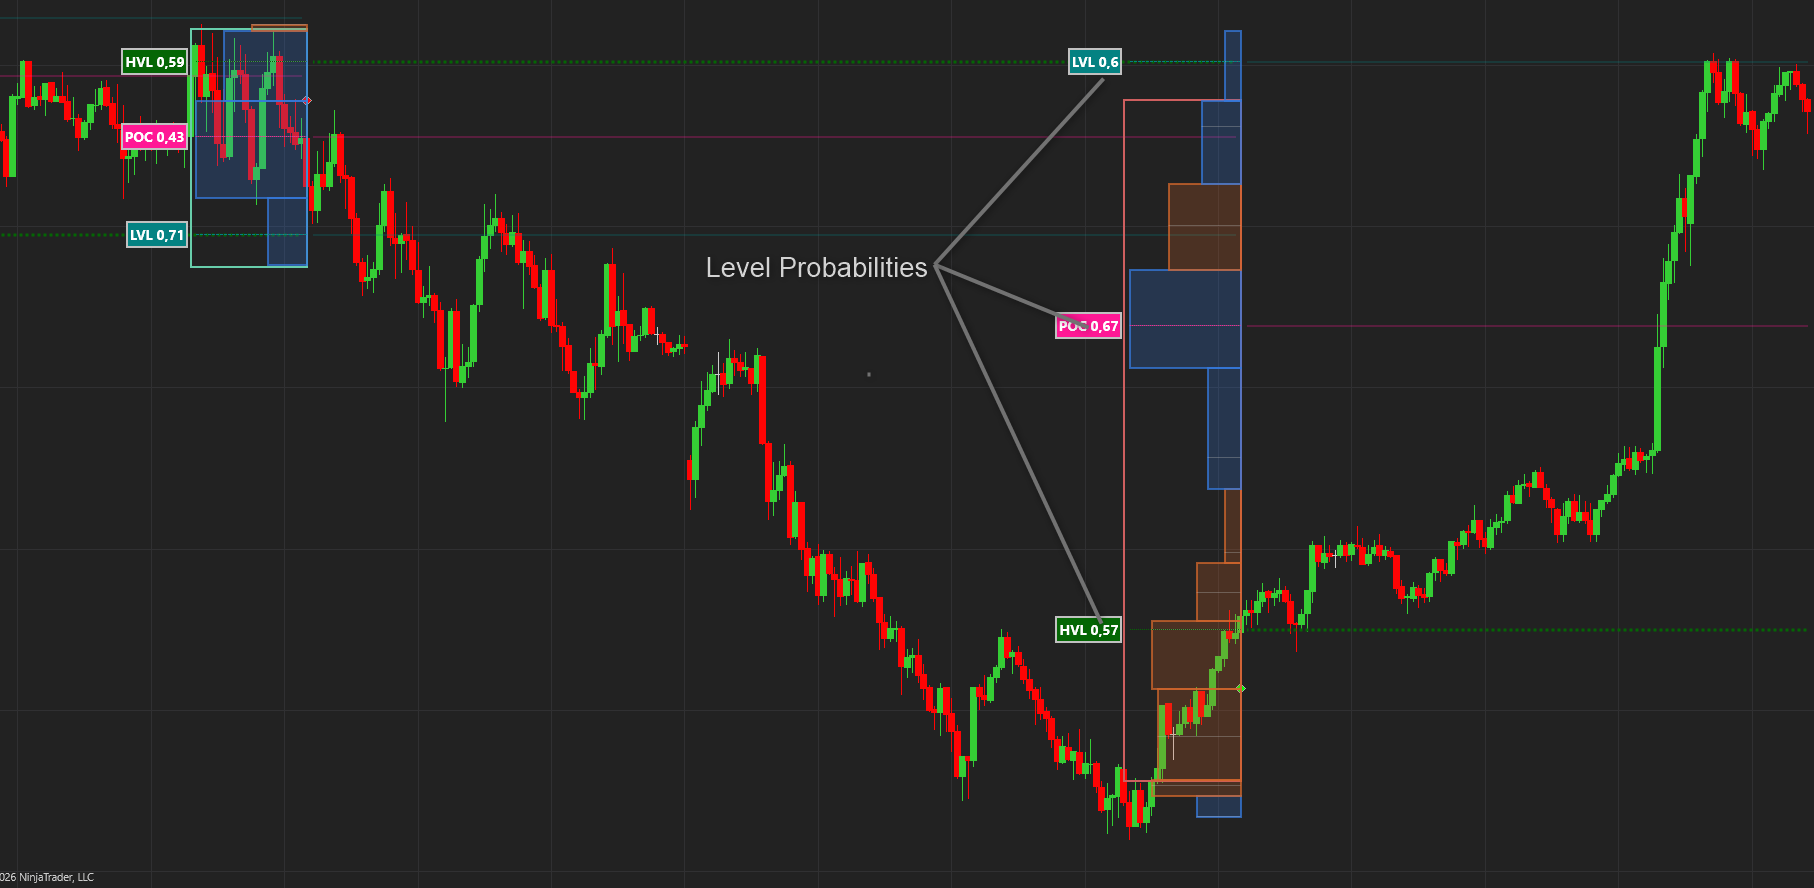
We calculate and display the probability of the price reaching each of the 3 levels, POC, HVL and LVL. This is from below in an uptrend and from above in a downtrend.
Value Area
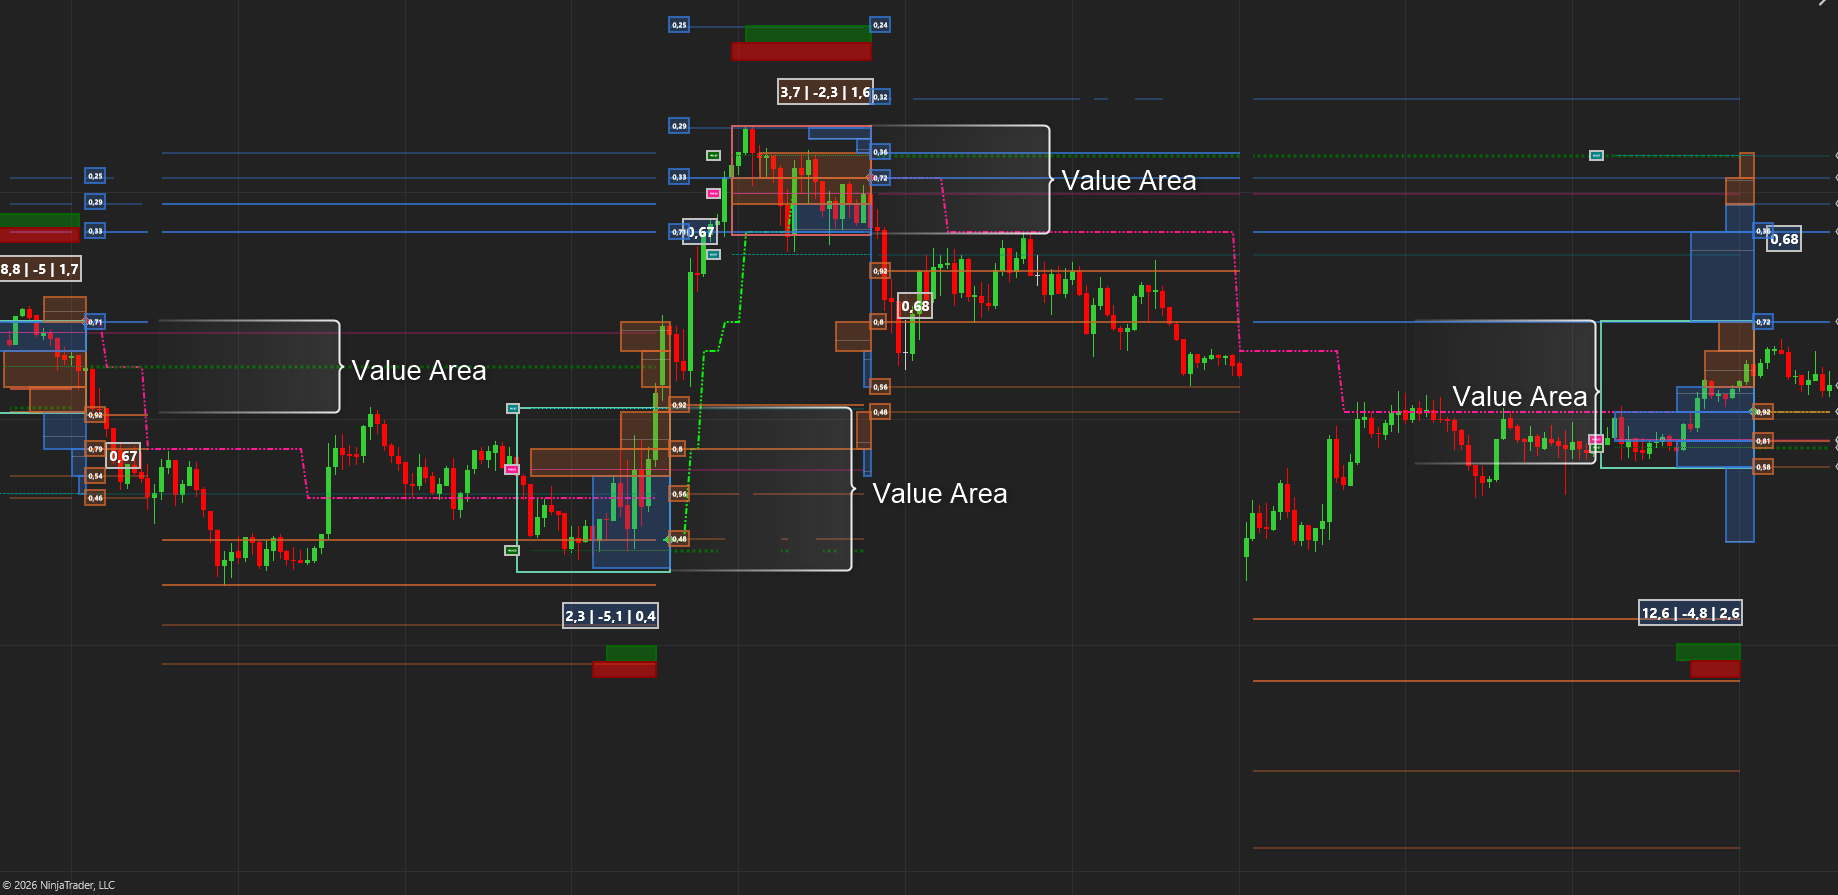
The Value Area is where a defined percentage of all the volume / heat traded in a distribution. We have added a setting to customize the percentage. The default value is 68.2% in line with statistical rules. You are welcome to adjust this setting to your liking. The color of the Value Area rectangle is determined by the delta for that profile / distribution. This is also fully customizable.
Support and Resistance
Since Heat profiles give us the best info to determine support and resistance we use past and present POCs to create a grid of SR levels.
These levels are only added to the list if they meet a certain criteria and we remove these levels when the market proves that they are no longer valid.
The levels are projected upon every trend change or if the price exceeds the furthest level.
We also calculate the probability of the price reaching each of the 4 Support and 4 Resistance levels in each trend movement. This is extremely helpful in setting Profit Targets, calculating Risk reward etc.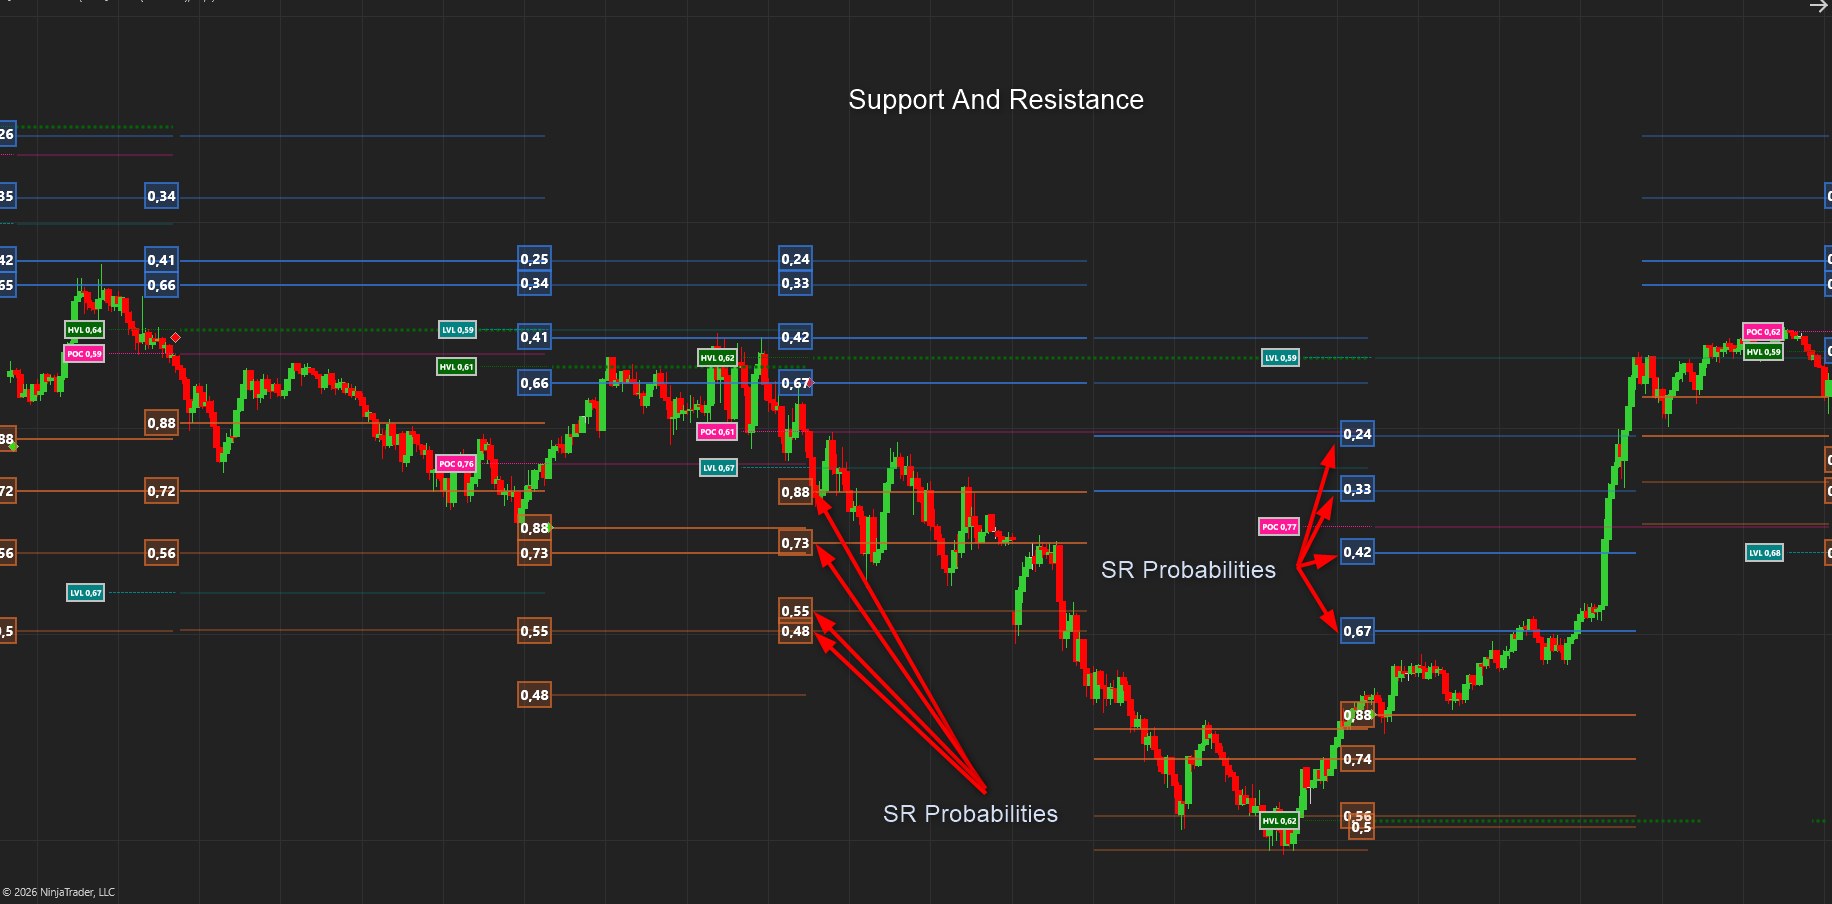
Trends
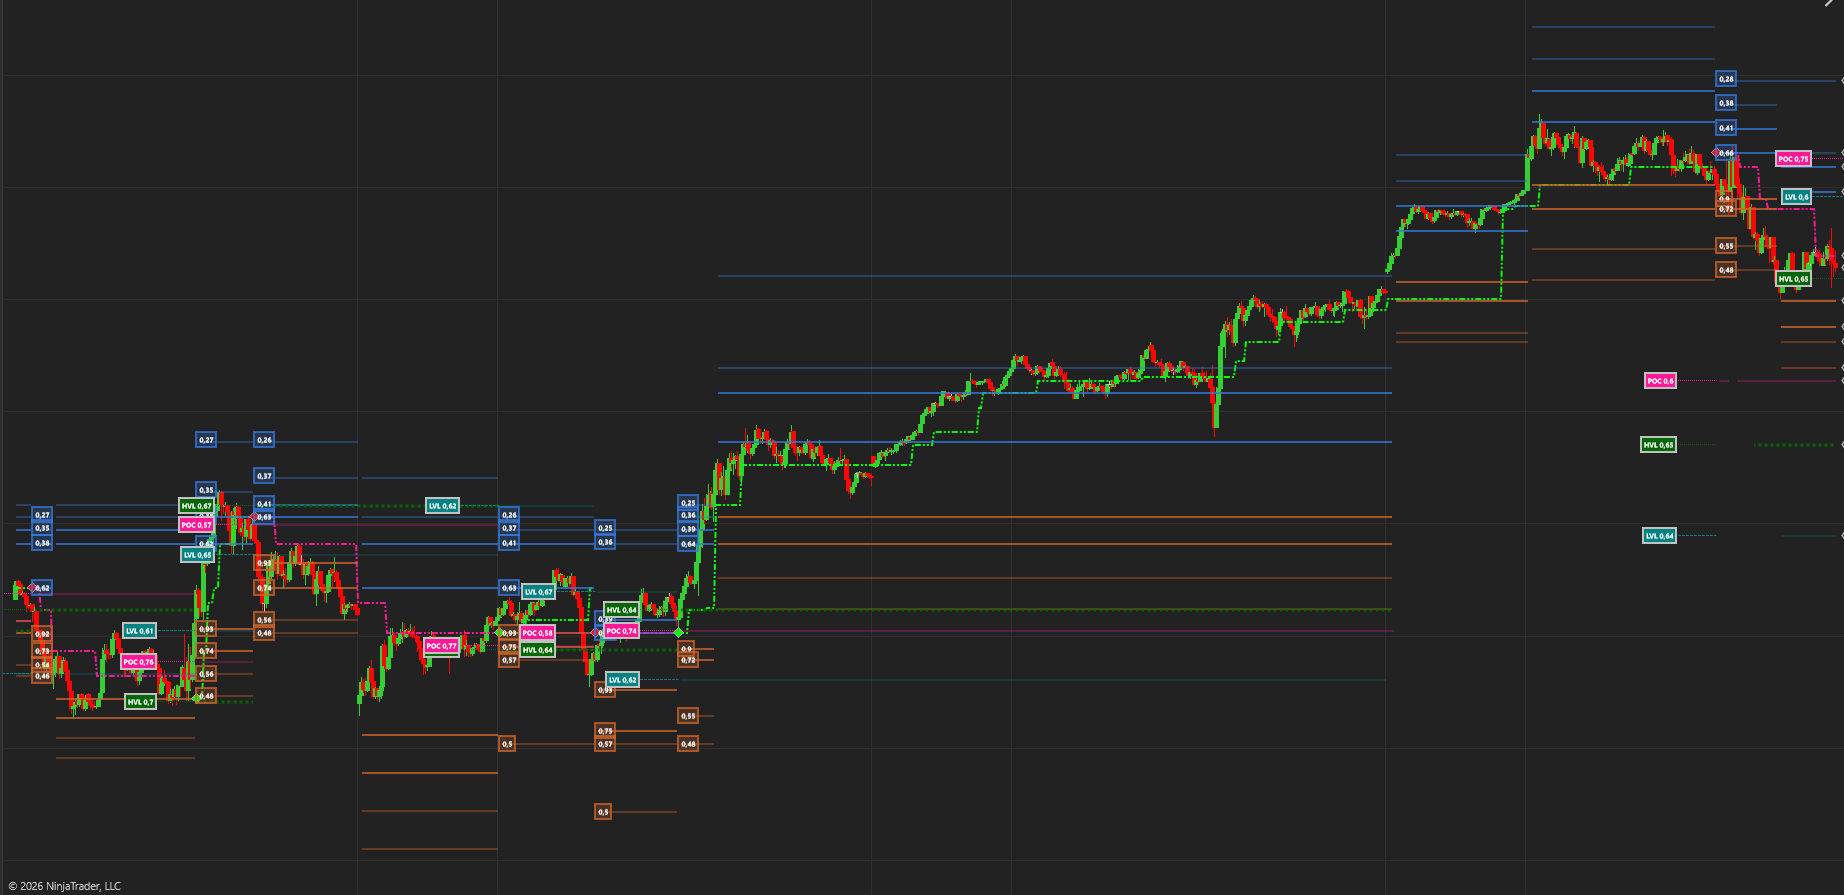
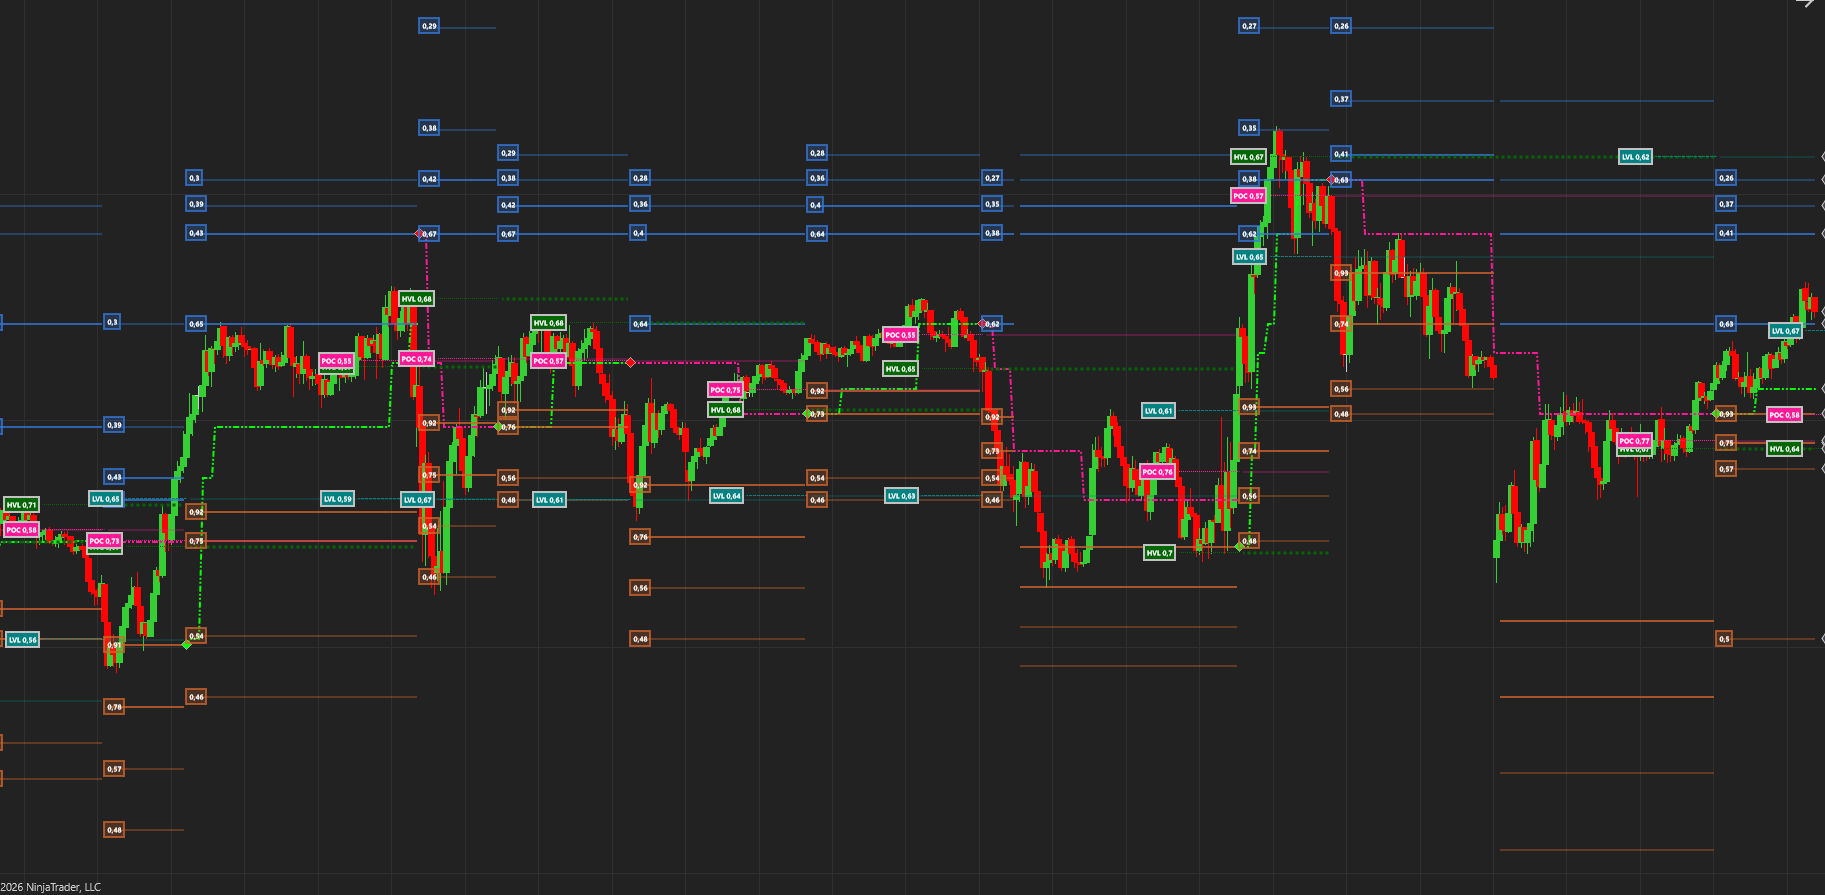
Armed with all the levels, probabilities, HVL, LVL, POC and Micro – Structure we are able to determine much better trends. a Lot less false signals. a Lot less whipsawing. The Trend changes don’t aim to find the top or bottom of each cycle but rather when the market has decisively shown that it has changed direction. We will rather be late and be more certain of the move than get stopped out too often.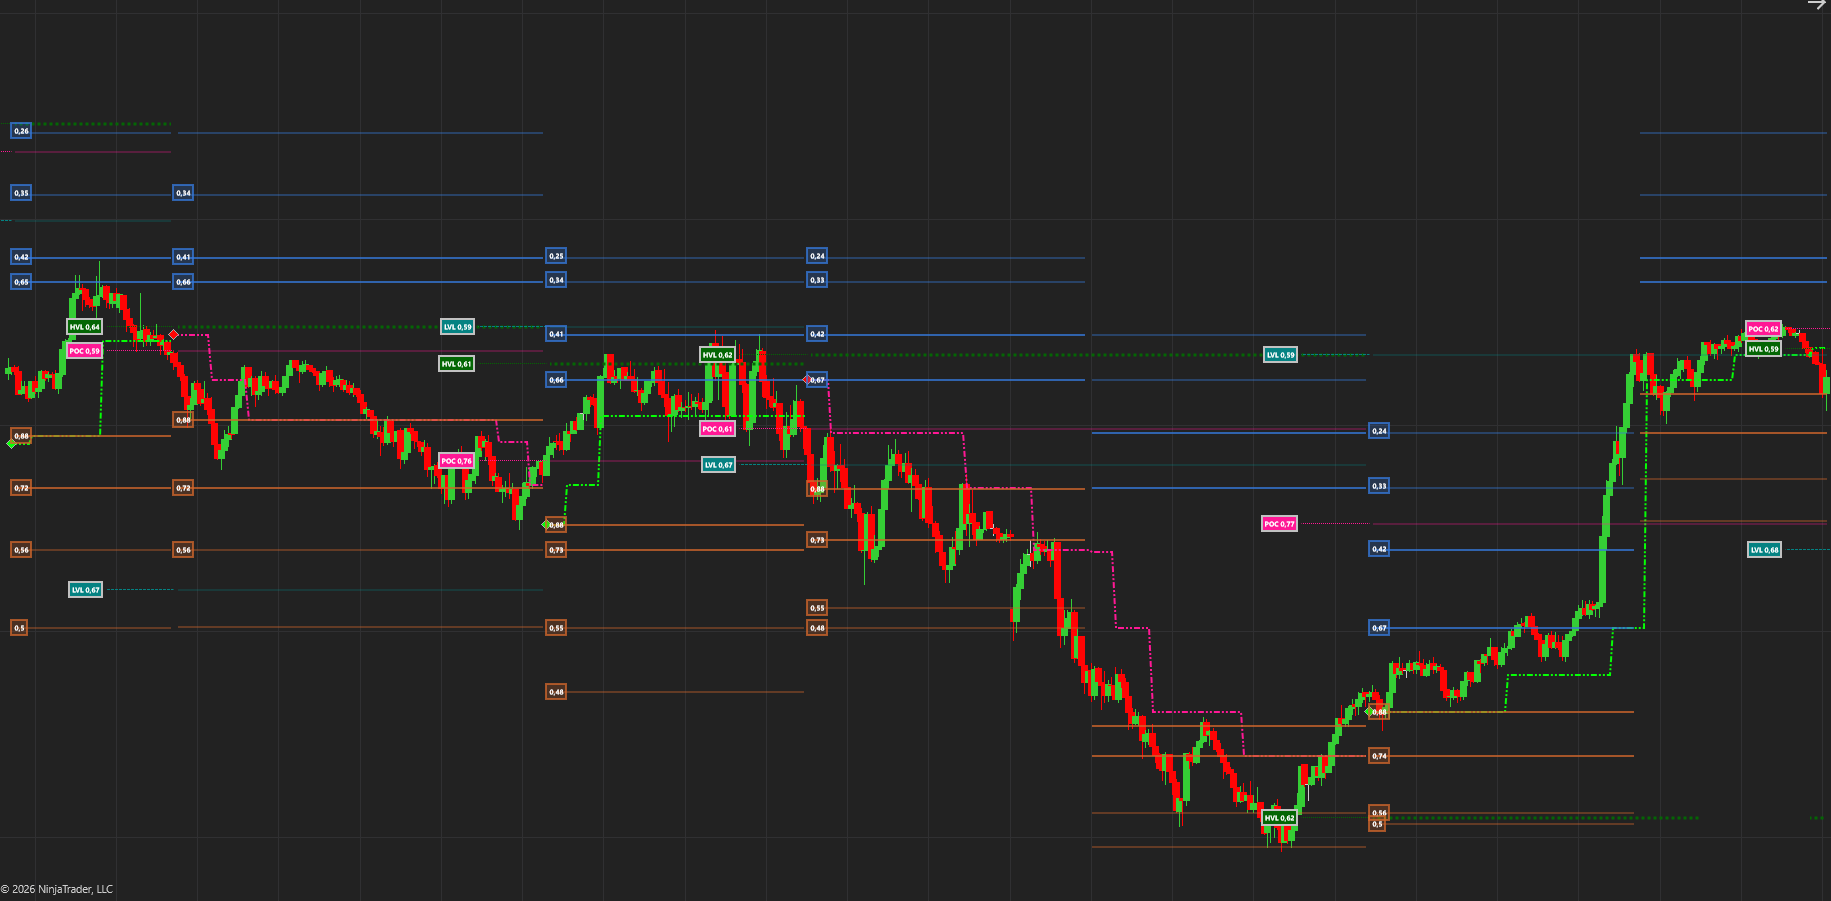
Stats Dashboard: Targets, Risk and Reward
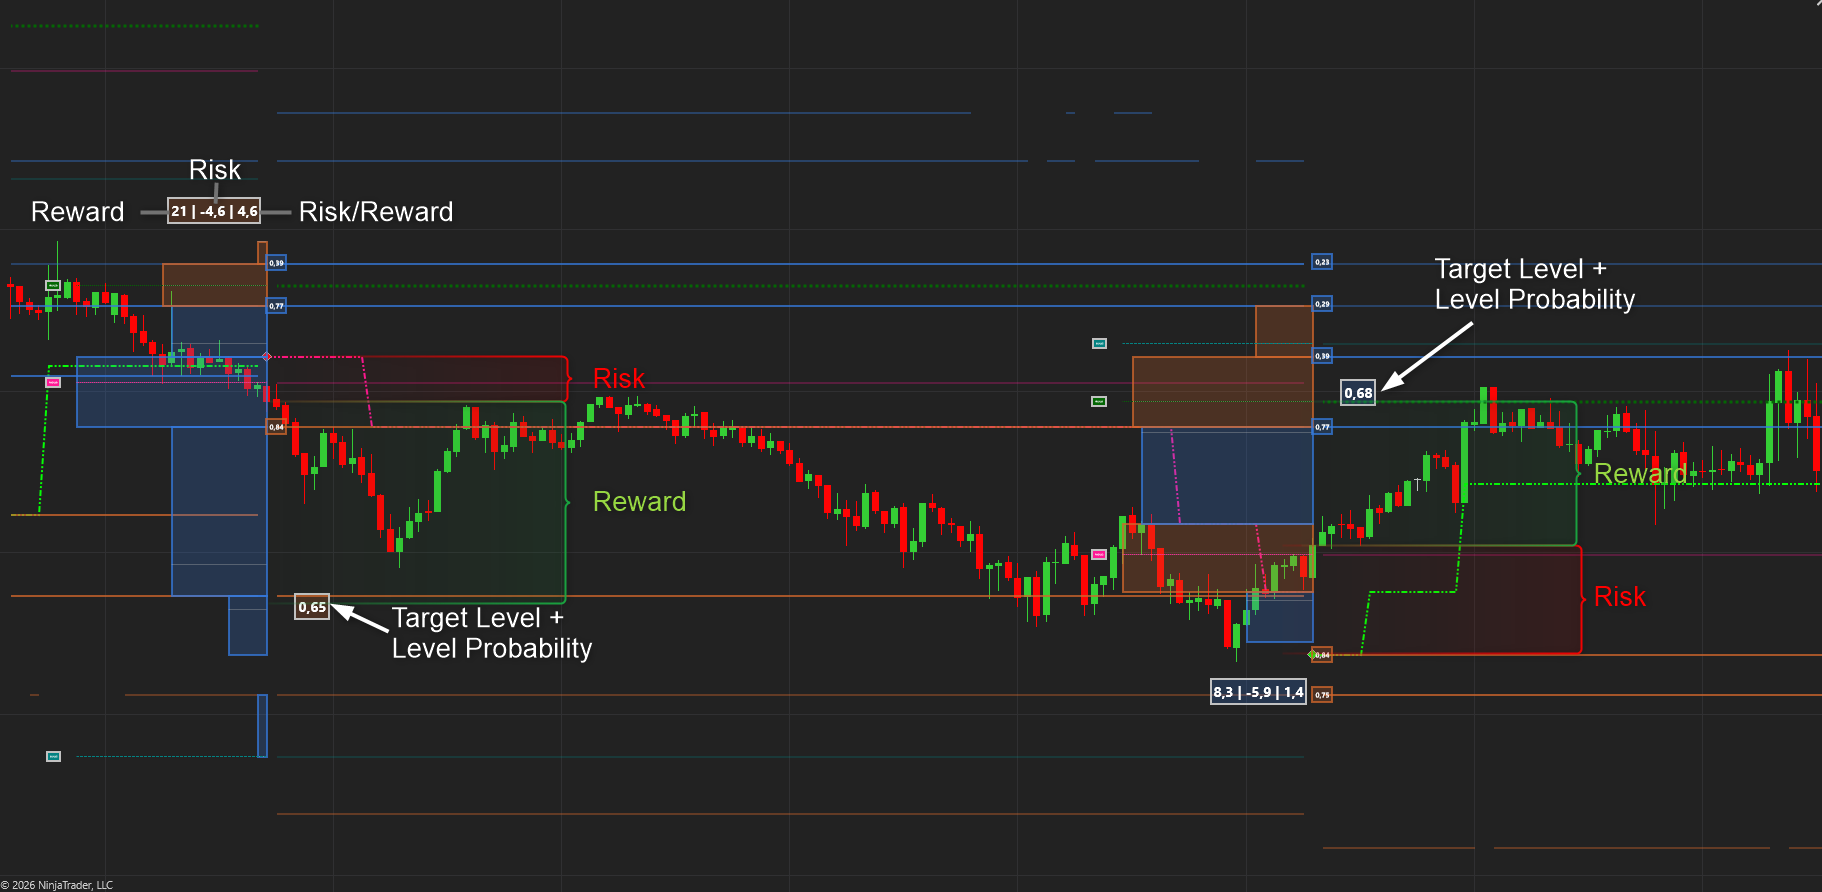
The dashboard gives us some quick and easy stats to determine our trading plan.
- It starts by making a potential profit forecast based on the probabilities of the SR and other levels. This gives us the potential reward. This method is statistically far more sound than using X ATR or other methods as it builds on the probabilities we determine and learn from,
- It calculates the risk by looking at the trailing SR level, the trend plot.
- Finally, it calculates the Risk to Reward ratio. Reward / Risk.
Probabilities
We also calculate and display the probability of the target being reached in the trend cycle.
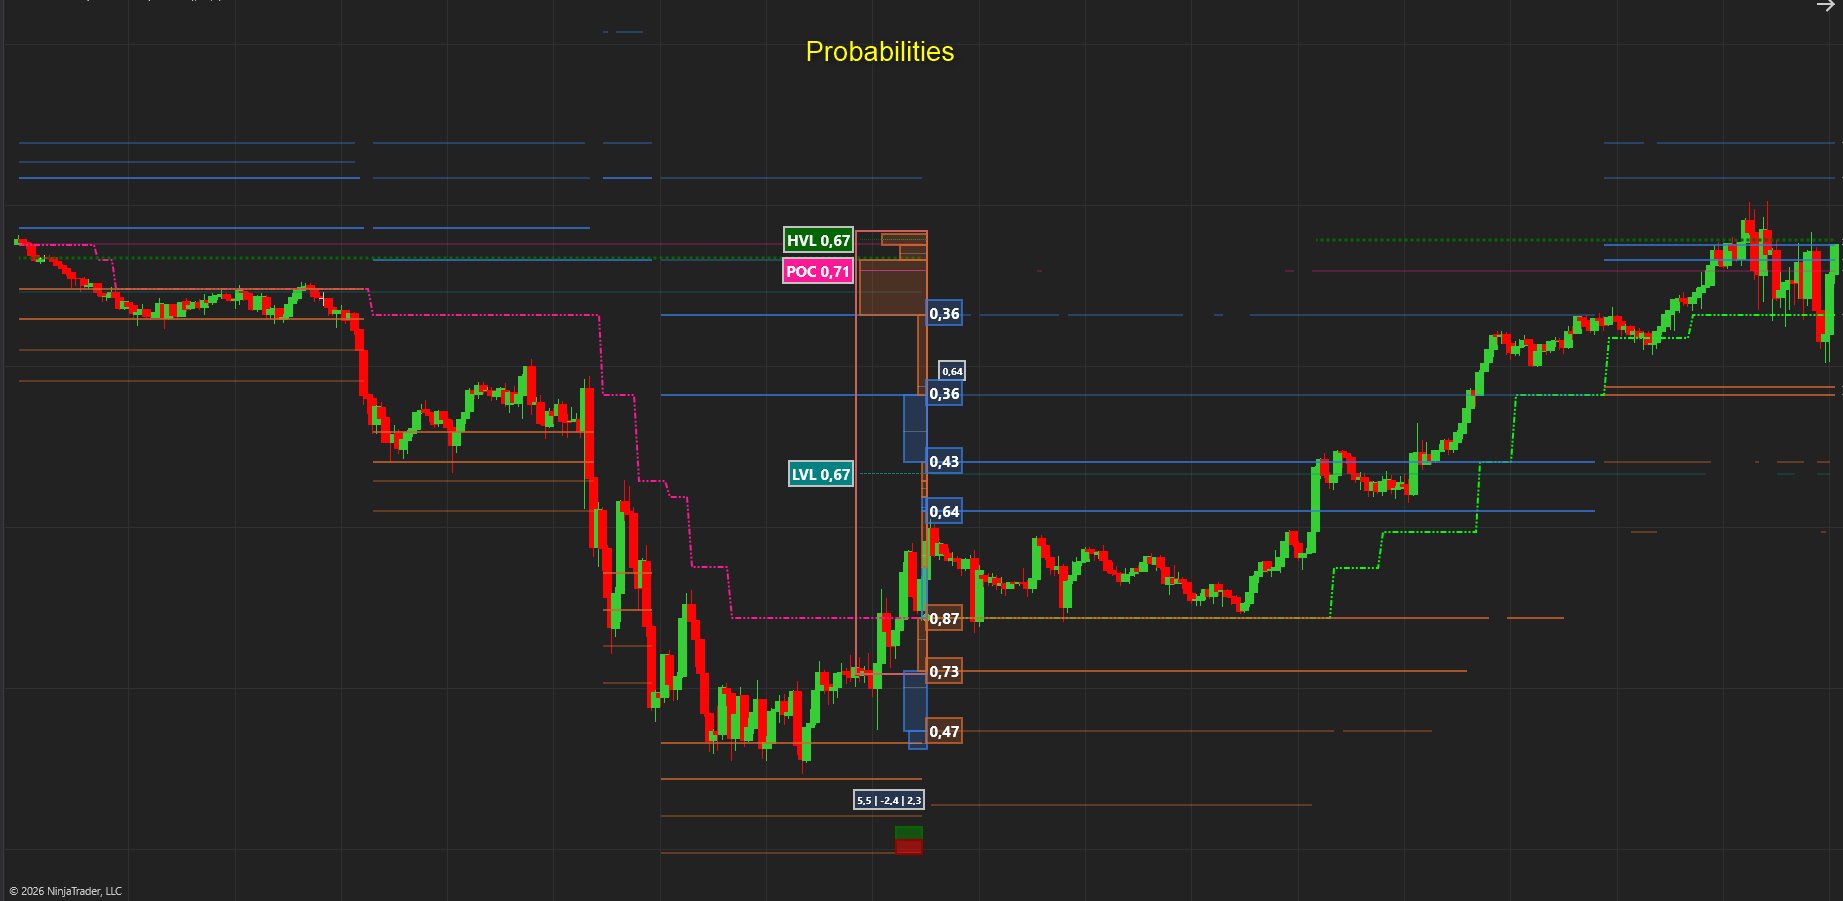
We calculate the probabilities of all the significant levels being reached in each trend cycle. We calculate it for all these levels :
- Resistance Levels 1 – 4
- Support Levels 1 – 4
- Point of Control
- High Value Level
- Low Value Level
- Long And Short Forecasts
Excellent for setting targets, entries and determining risk.
Heat Cycle Relative
The Heat Profile also incorporates a signal that displays the Heat for the most recent cycle compared to the previous cycle when the trend flips.
Relative scaling: The widths of the rectangles are scaled against each other, so you instantly see which timeframe’s heat is dominant.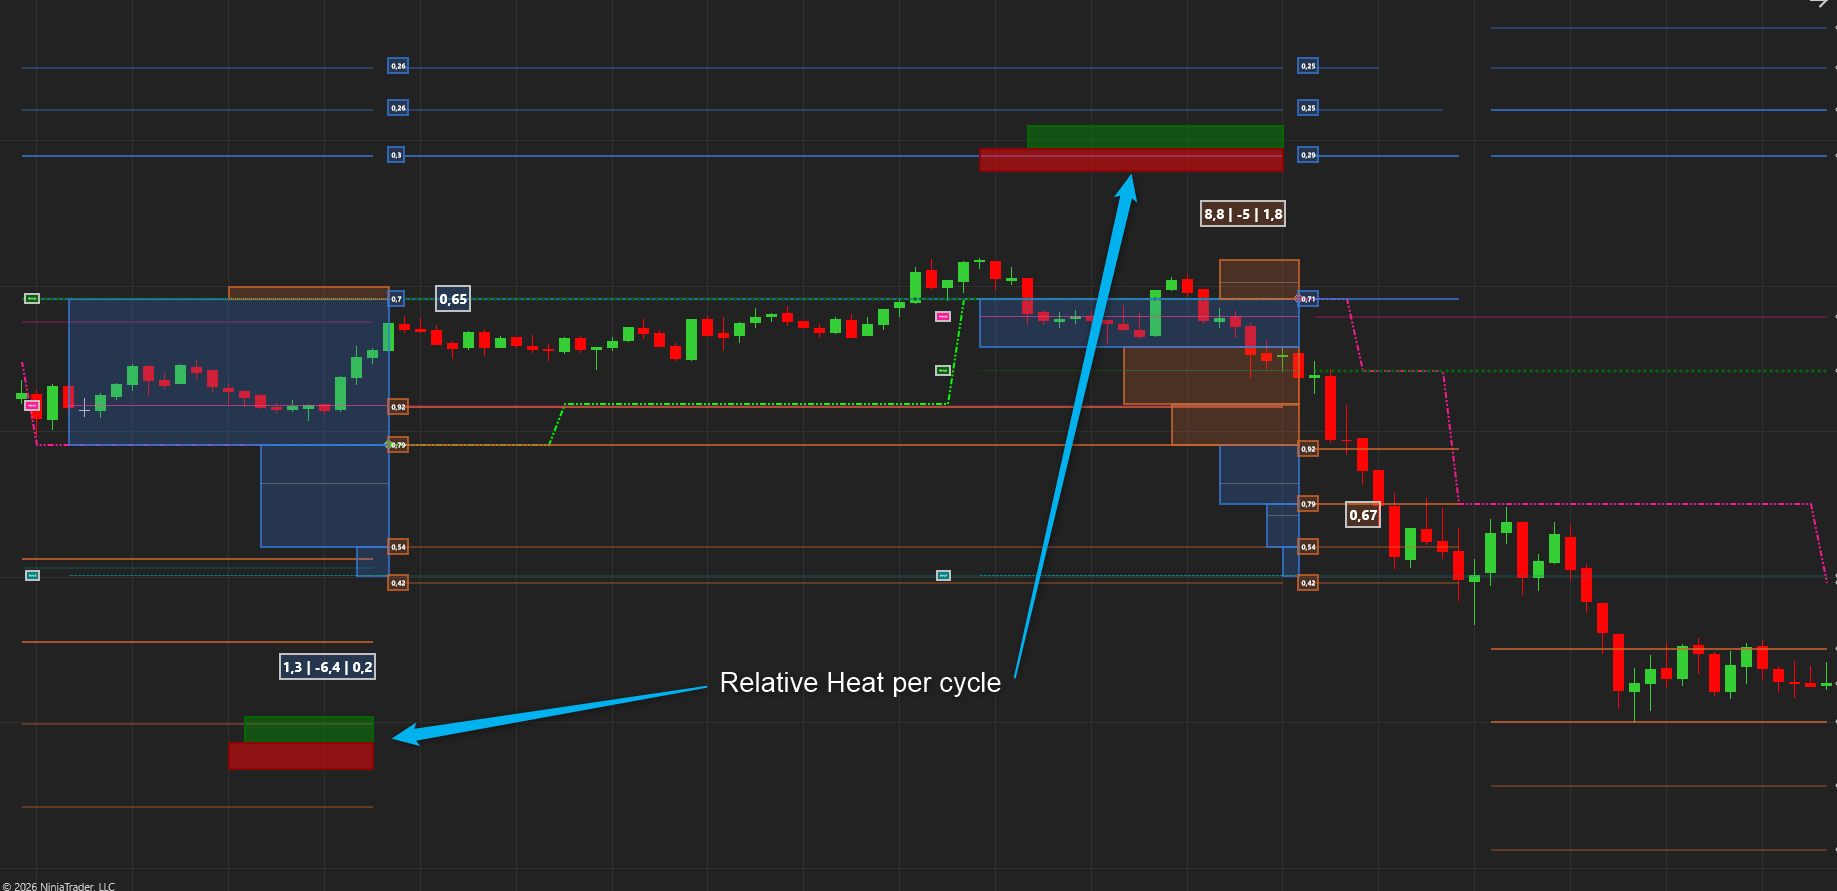
Settings and Customization
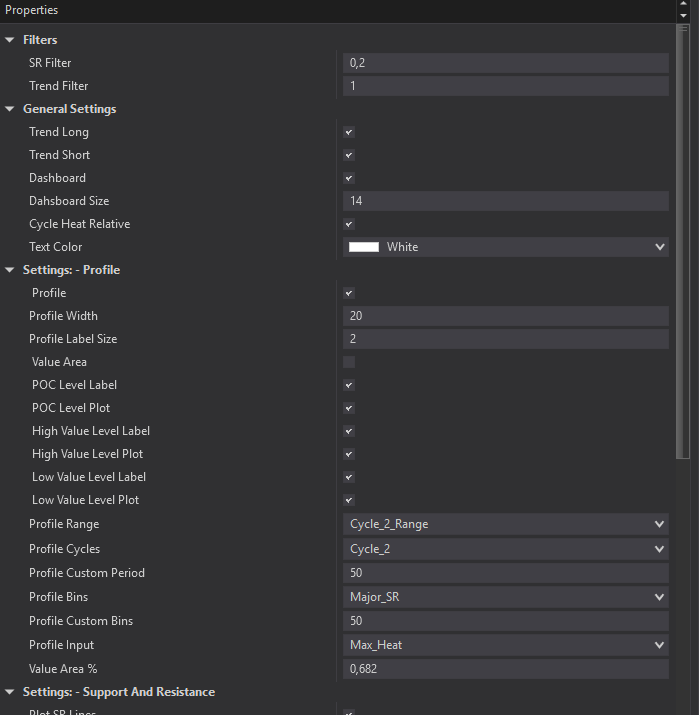
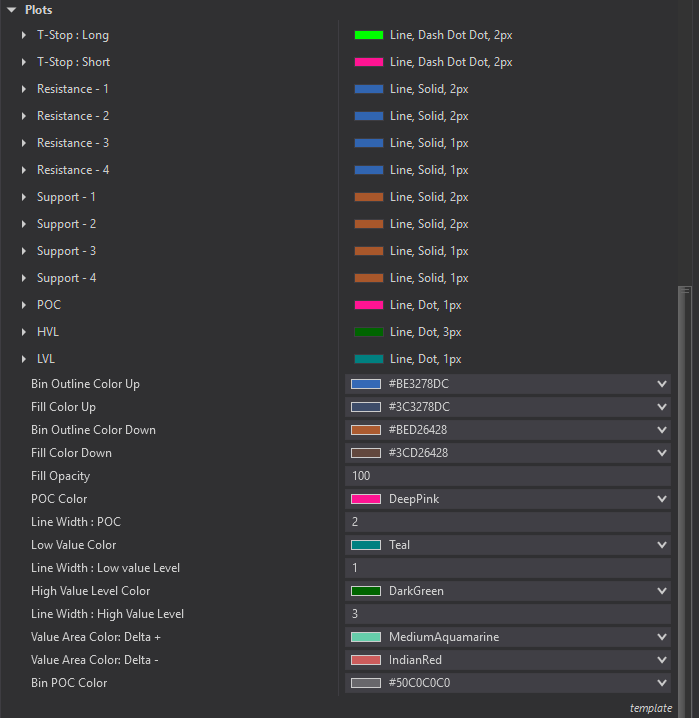
This indicator is fully customizable in terms of calculation methods, settings and visualization. There is a user manual included in the download that explains all of this fully.
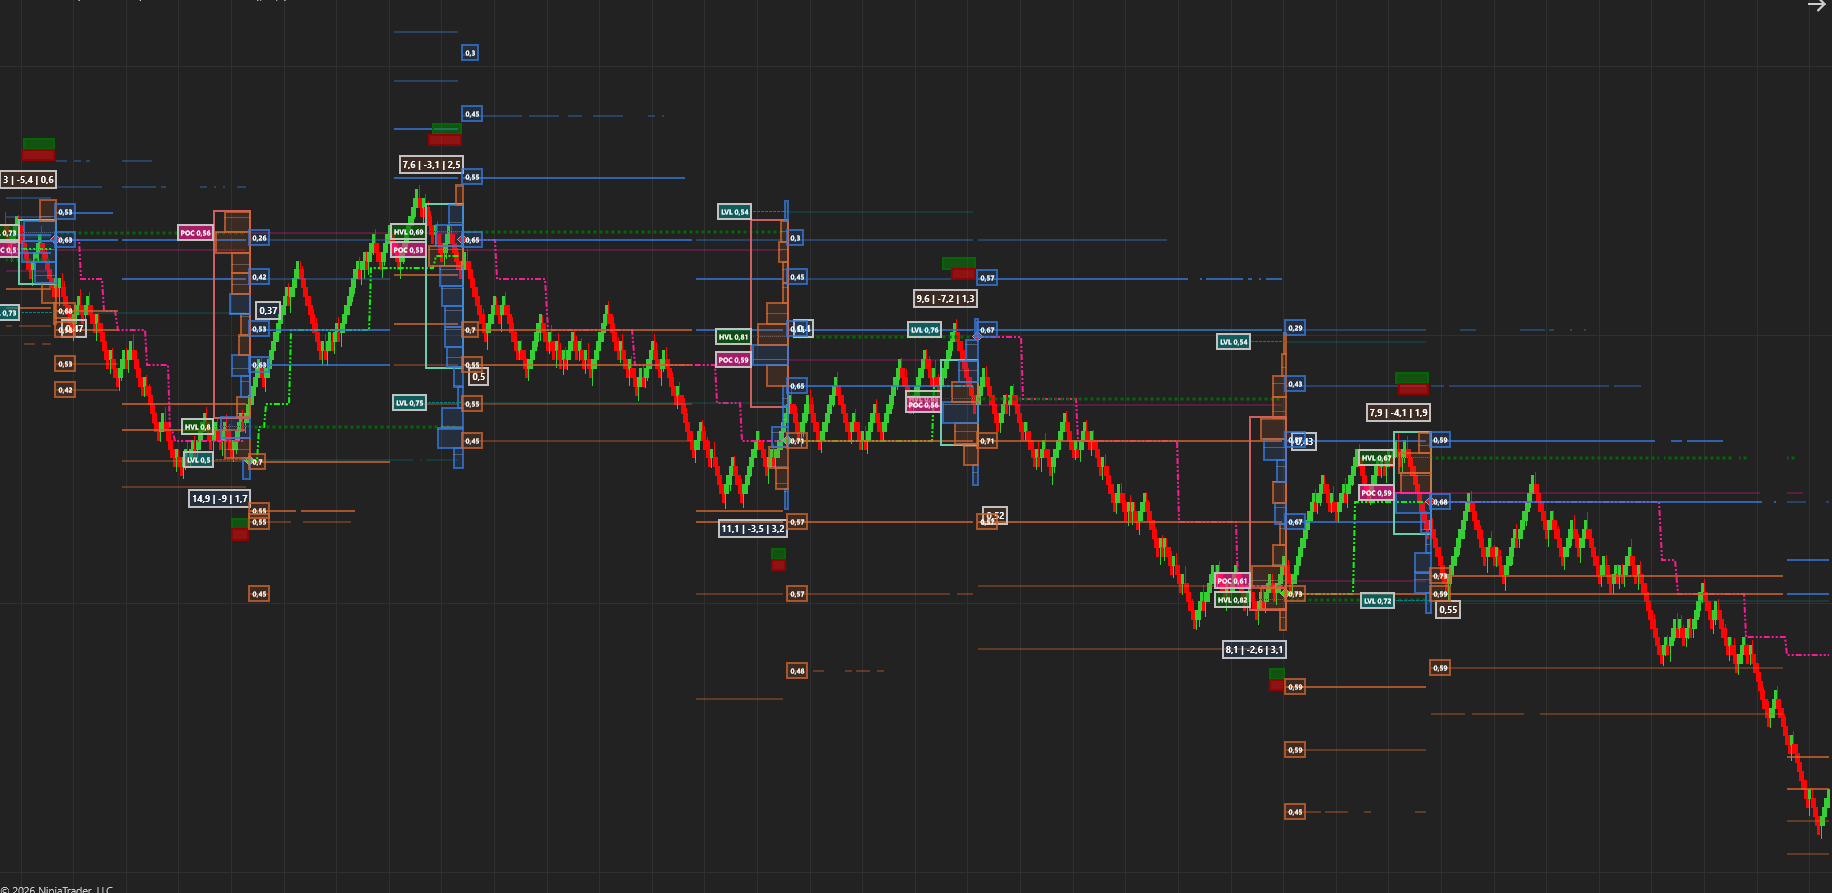
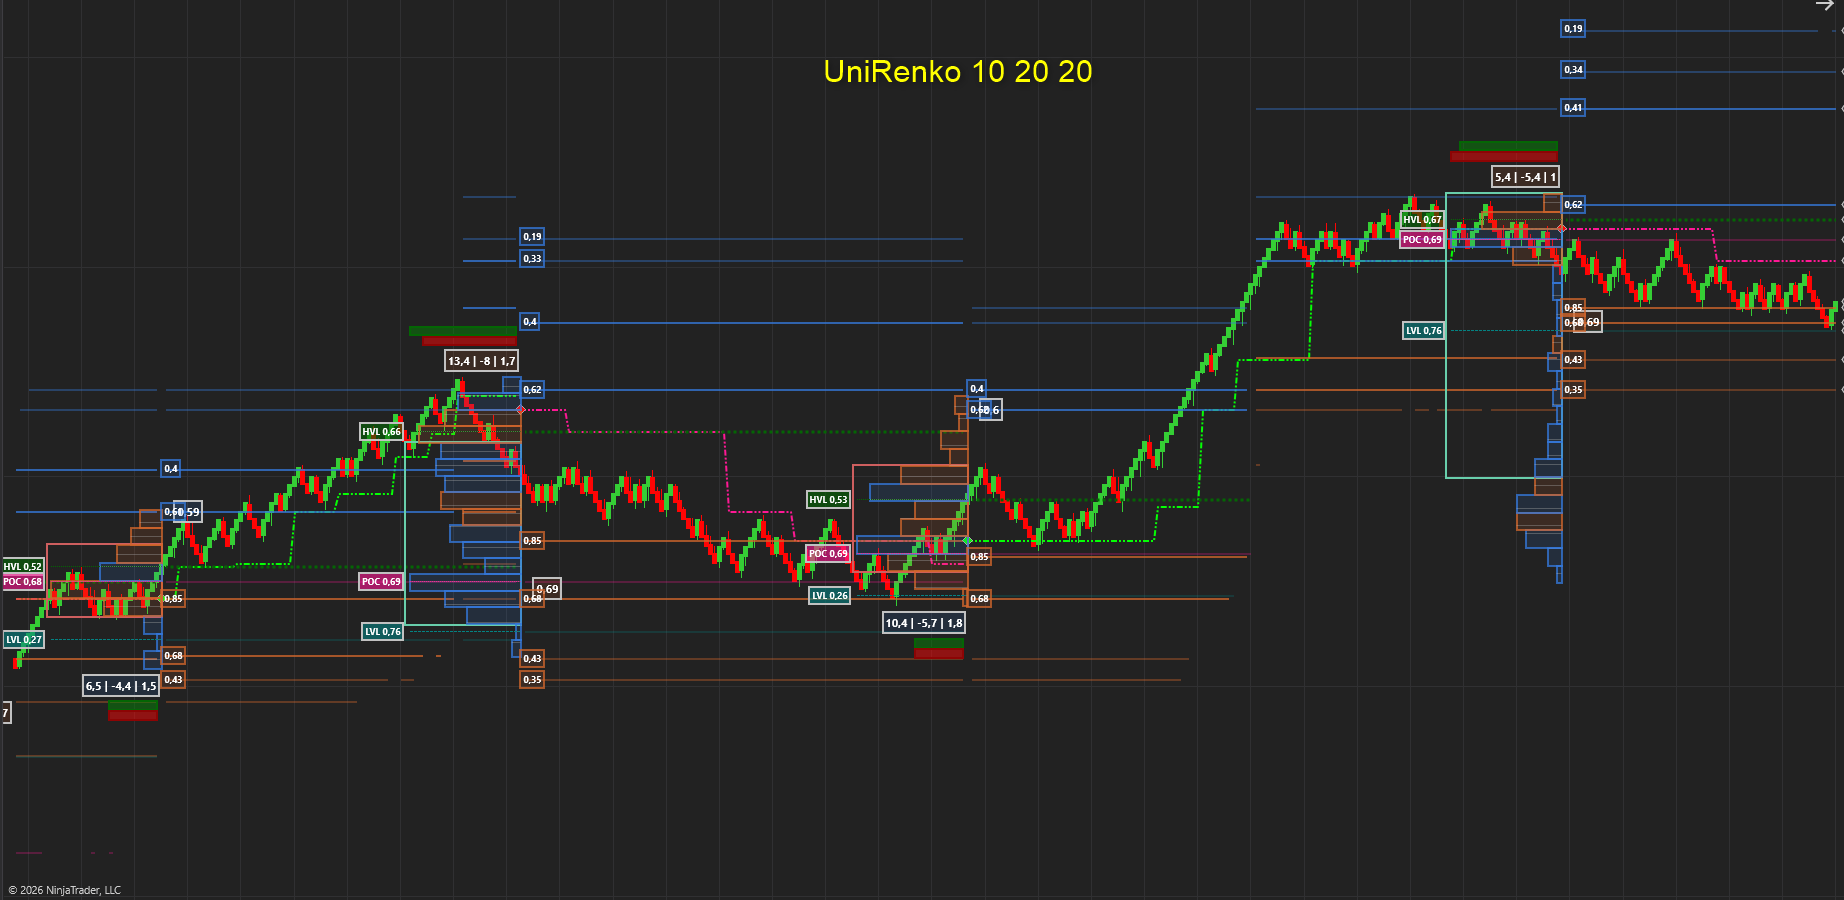
Renko Bars
Special Notes:
Works on All Timeframes and Bar Types
Please load sufficient data on a chart to get the best out of this tool. It needs to learn!
1 Minute +- 10 days or more
5 Minute +- 30 days or more.
10 Minute +- 40 days or more
15 Minute +- 40 days or more
Renko 20 20 40 +- 10 days or more.
We Trust that this tool will help you trade like a Professional and vastly improve your trading