Volume Profile
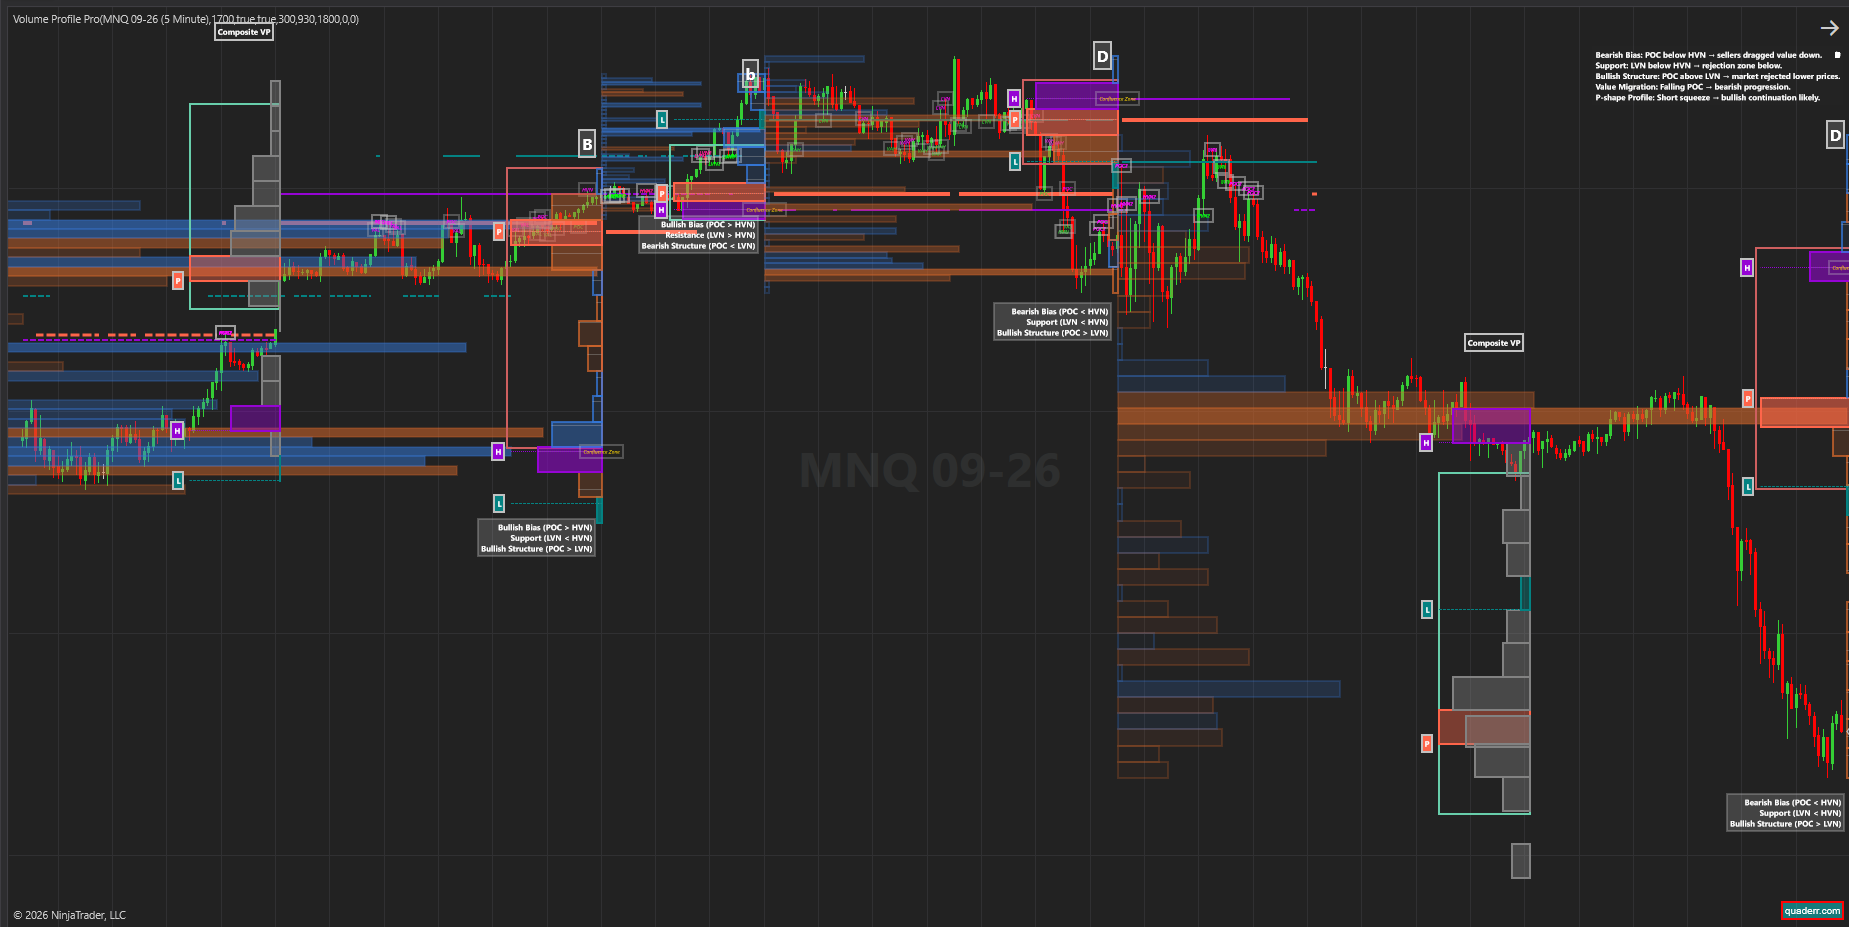
Trade Smarter with the Ultimate Volume Profile Indicator
Unlock the Market’s Hidden Levels with the Ultimate Volume Profile Indicator –
Trade smarter with real‑time profiles, composite analysis, and voice alerts
Designed for day traders, swing traders, and professionals who demand clarity and precision.
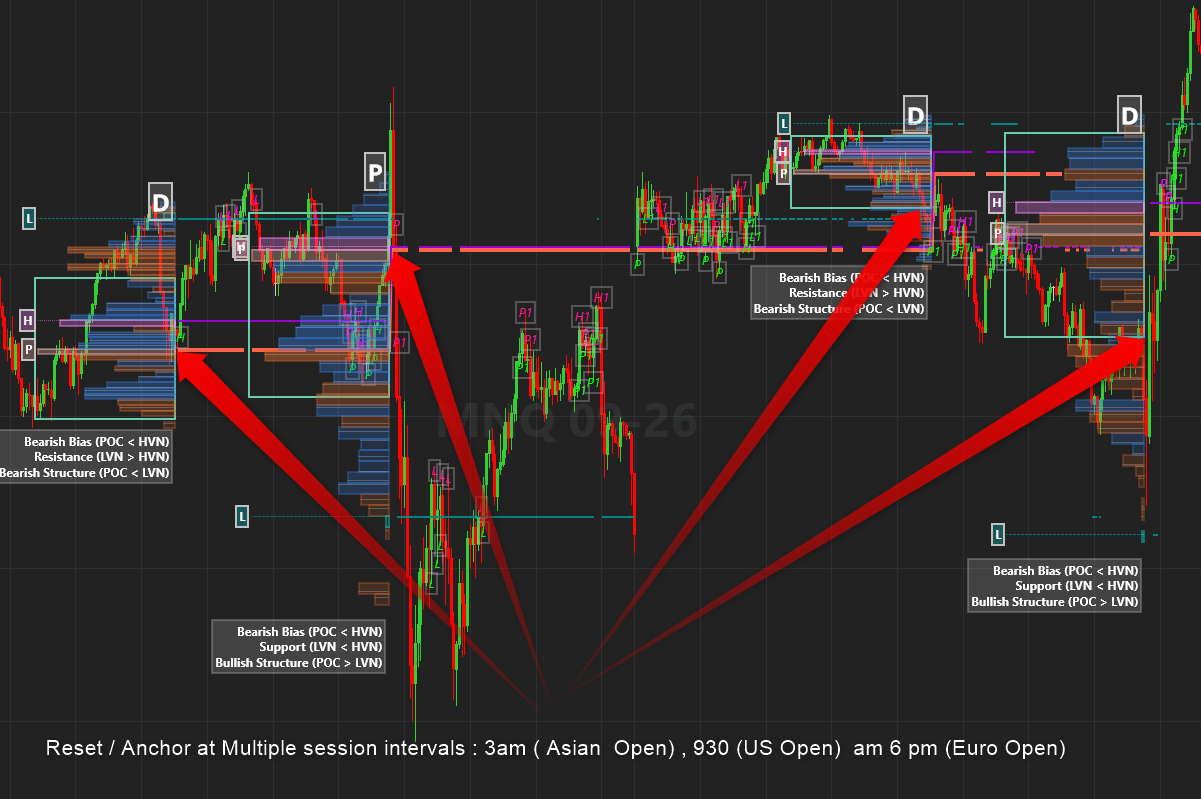
Volume Profile Pro gives traders the ability to reset and track volume profiles over 5 distinct reset/ anchor periods.
Three Distinct Profiles — One Complete Picture
Volume Profile Pro gives you three different ways to read the auction:
- Session Profiles → Reset at anchor times during the day to capture intraday flows. Perfect for scalpers and day traders who need to see how each session builds value.
- Create up to 5 reset / re-anchor time periods to draw multiple Volume Profiles that captures each session`s unique characteristics
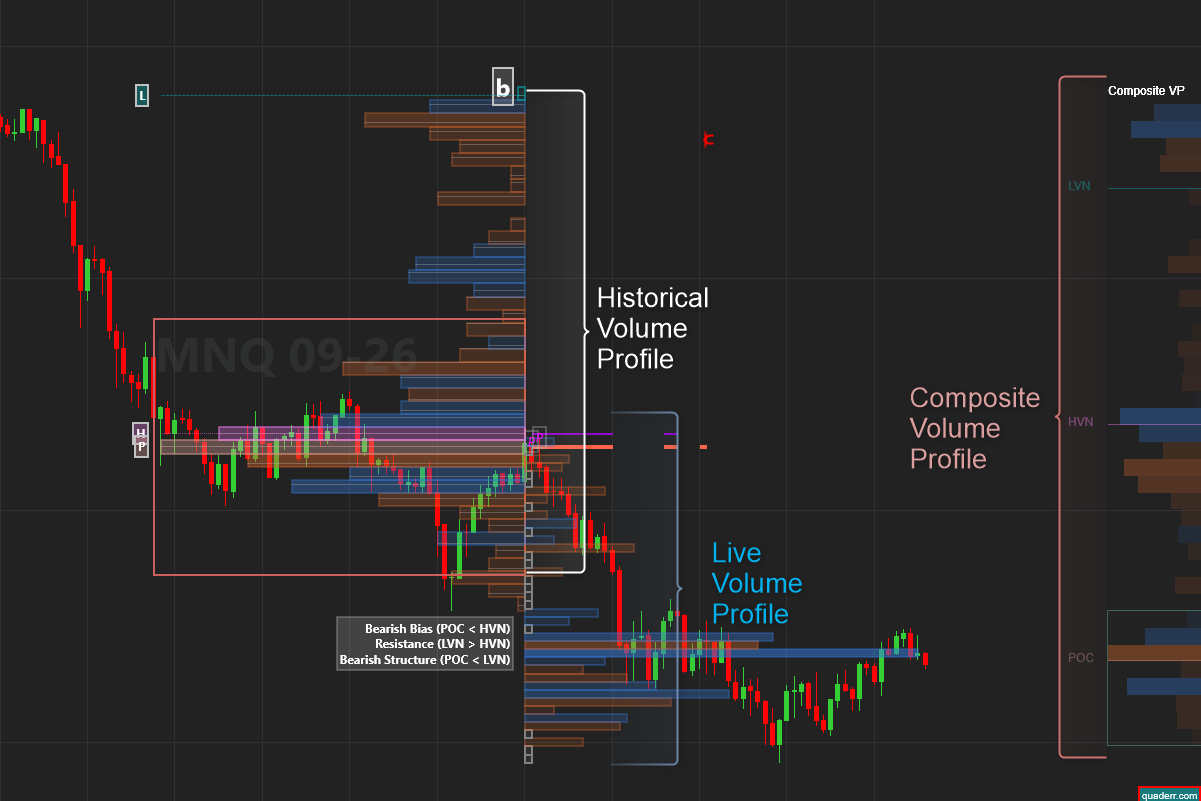
- Composite Profiles (Pro) → Aggregate multiple sessions into one long‑term distribution. Swing traders use this to spot macro acceptance zones and institutional levels.
- Live Profiles (Pro) → Continuously update in real time as each bar prints. Ideal for traders who want to see evolving volume context tick‑by‑tick.
Together, these three profiles let you zoom in, zoom out, and stay live — giving you a complete auction‑theory toolkit.
Flexible Inputs — Choose Your Lens
Not all traders read the market the same way. That’s why Volume Profile Pro lets you choose the input type:
- Volume → Classic auction theory.
- Time (TPO) → Market profile style.
- VolumeTime → A hybrid of both.
- Delta / DeltaVolume (Pro) → See buy vs sell imbalance.
- VolumeDensity (Pro) → Spot thin vs thick zones in distribution.
This means you can tailor the profile to your strategy — whether you’re fading balance edges, trading momentum, or analyzing institutional footprints.
Smart Binning — Control the Detail
Profiles are built from bins — slices of price where volume is measured. With Volume Profile Pro, you decide how bins are calculated:
- ATR → Adaptive to volatility.
- Noise → Smooths out insignificant moves.
- Custom Bins → Exact control over granularity.
- Points → Fixed increments (e.g., every 1 point in ES futures).
More bins = finer detail. Fewer bins = cleaner profiles. You’re in control.
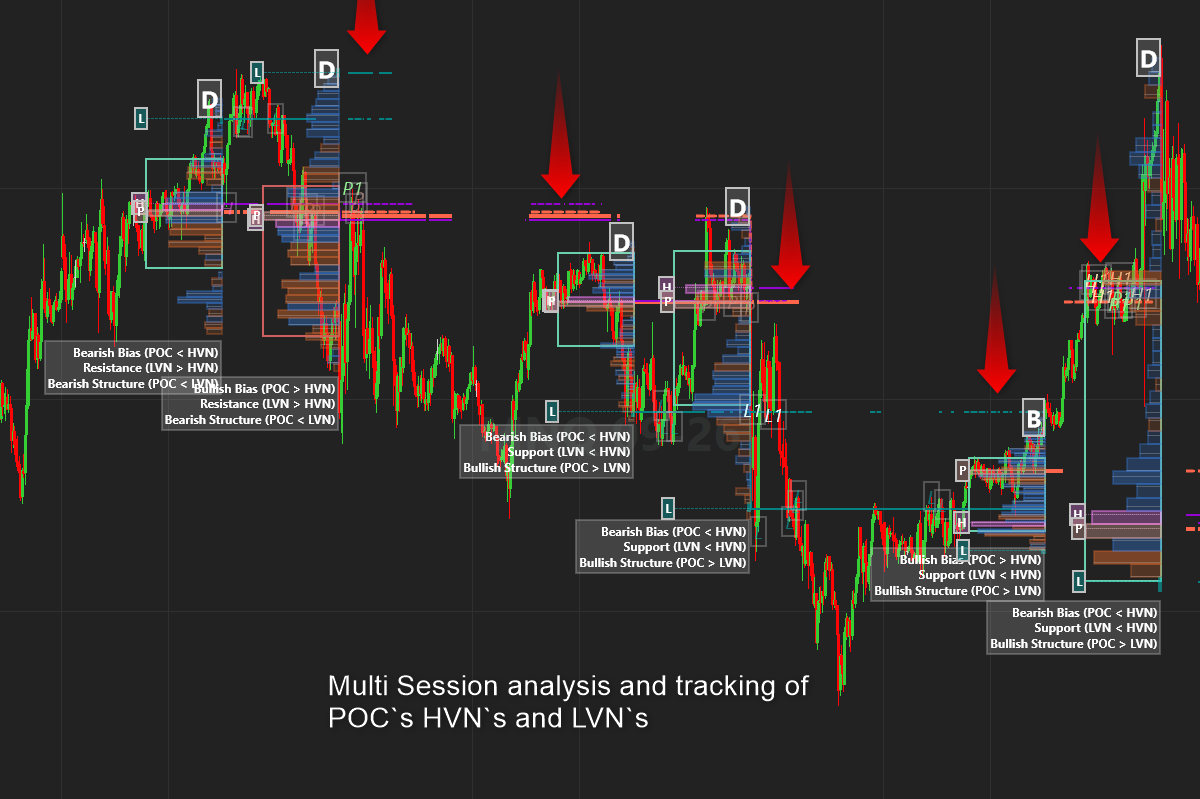
Multi Session Analyses (Pro)
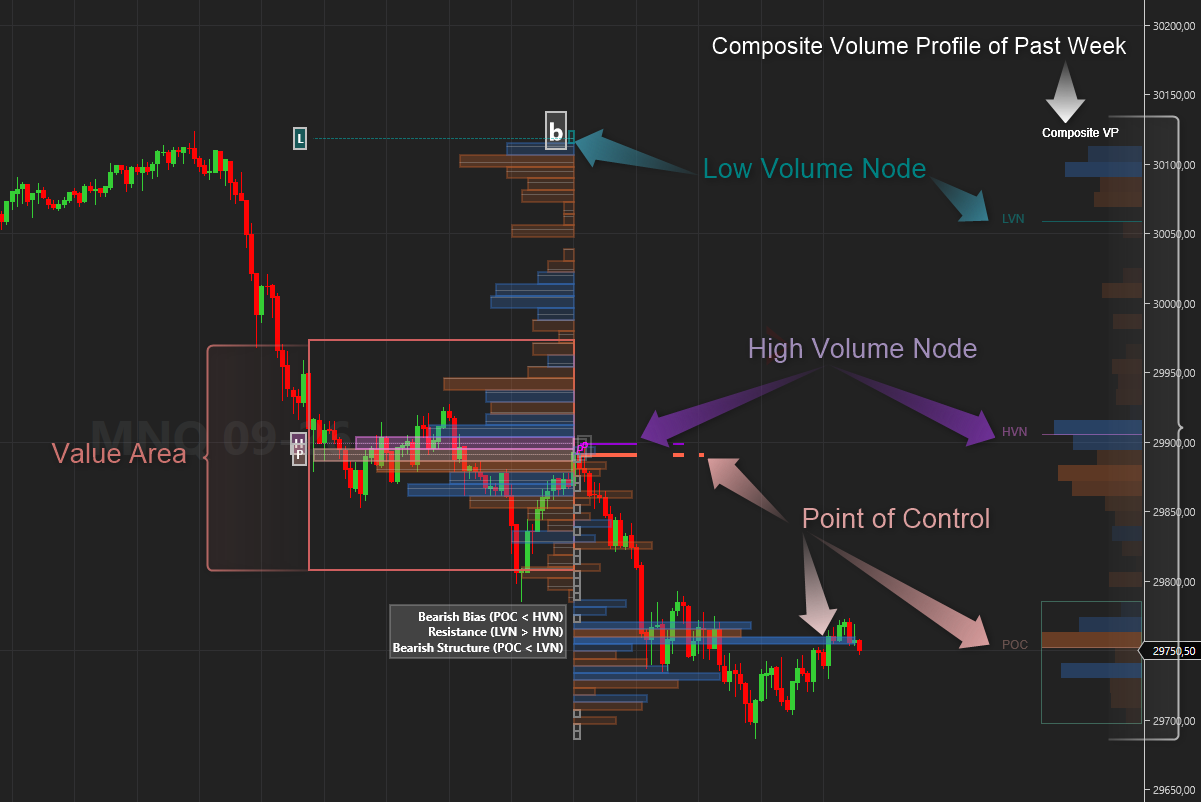
It also allows you to track the POCs, HVNs and LVNs for the past 2 prior sessions along with the current Sessions values, Colors . width etc. are fully customizable on these plots.
Alerts & Signals (Pro)
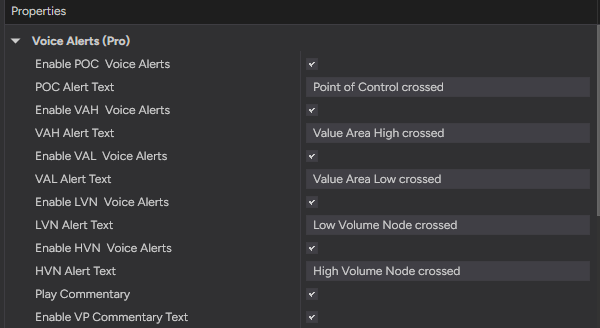
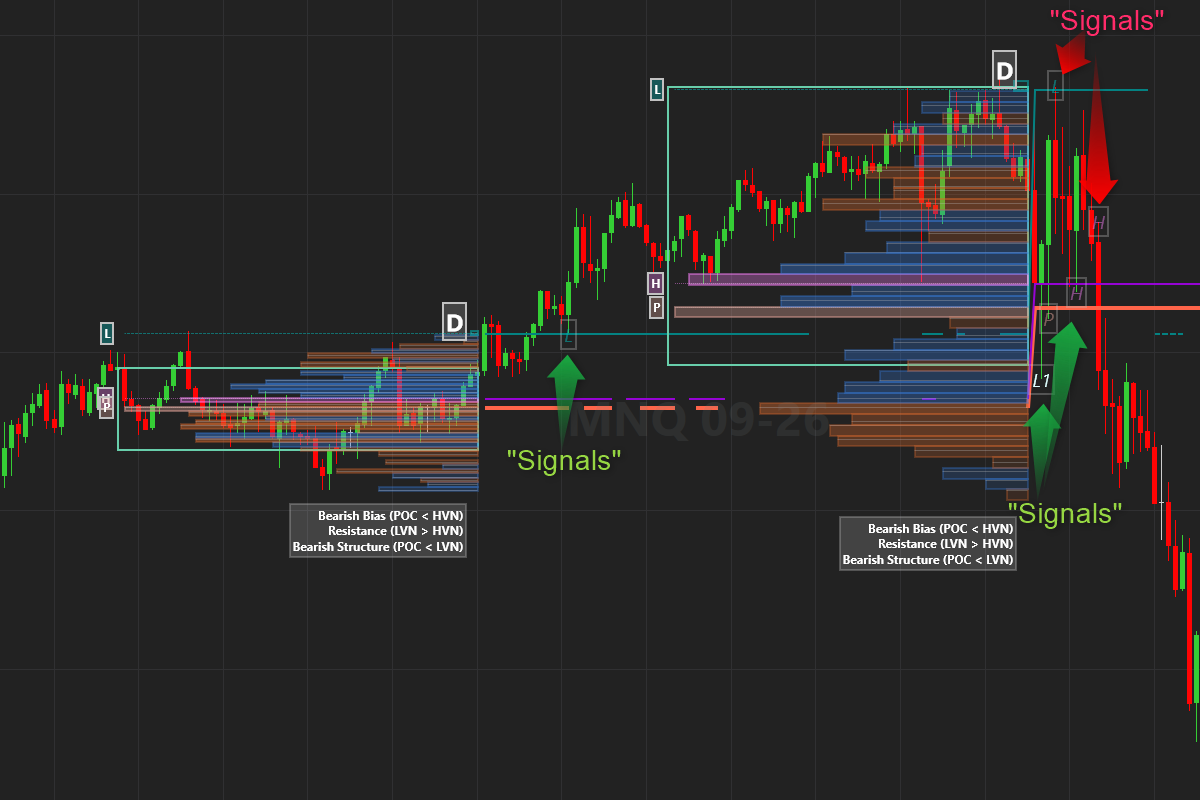
Trading isn’t just about seeing levels — it’s about acting on them. Volume Profile Pro gives you voice alerts, custom texts, and chart signals when price touches POC, VAH, VAL, HVN, or LVN. Multi‑session logic means alerts extend to prior levels too, so you never miss institutional retests.
“Signals” On chart notifications of a strong interaction with a level
Context Analyses (Pro)
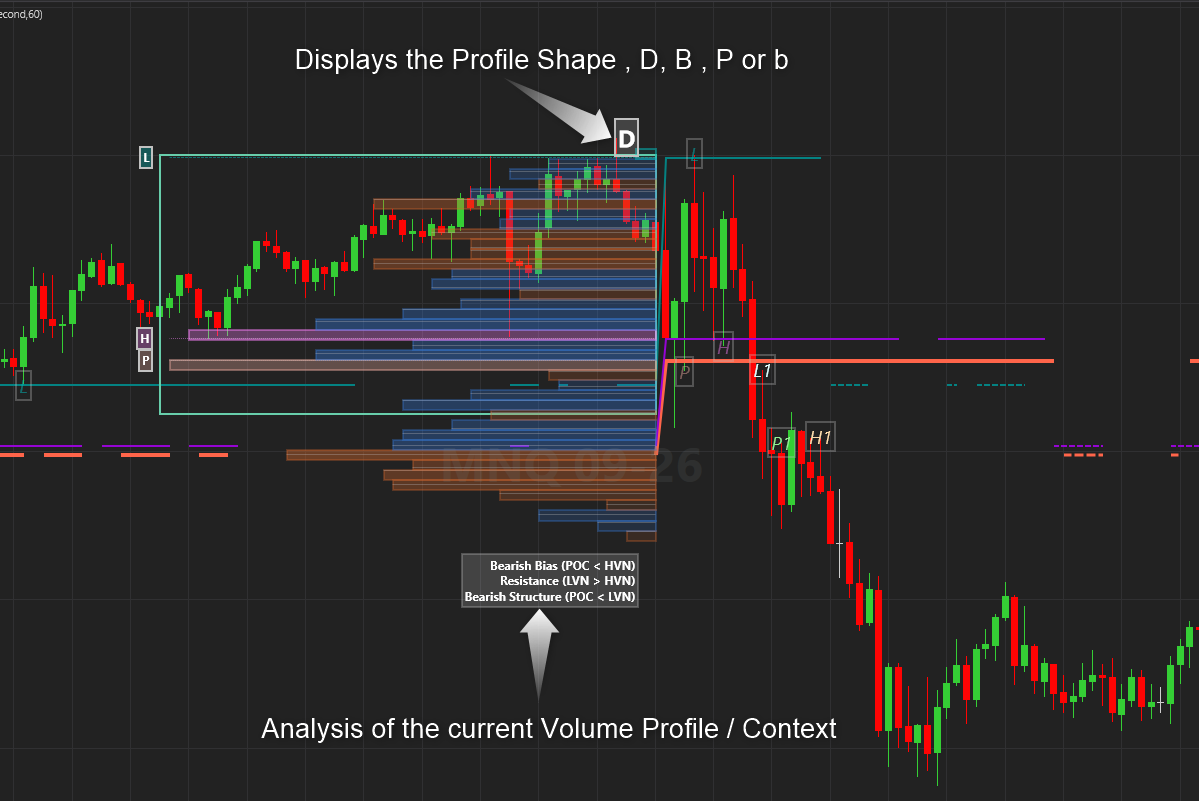
This analyses helps us to understand the context of the market and helps us trade with the market. This label plots when a new Volume profile forms, at the reset / anchor time. It can be turned off if you dont wish to show it.
In the example below :
Bias = Bearish since the POC is below the HVN, the LVN is above both the POC and HVN, meaning that the market reject at the LVN above the POC and HVN, This means reversal are likely from the LVN. The LVN is the resistance until its broken .
We have a full guide explaining these concepts available at the bottom of this page.
* a Complete User manual is included with the download
Comparison: Free vs Pro version
| Feature | Free Version | Pro Version |
|---|---|---|
| Plot Colors & Styling | ✔️ Full customization of bin colors, POC/VAH/VAL colors, label text, line widths | ✔️ Same features |
| Display Settings | ✔️ Profile width, label sizes (profiles only), Value Area toggle, POC/VAH/VAL labels & plots | ✔️ Adds signal label size and commentary label size |
| Session Profiles | ✔️ Draw session profiles, up to 5 anchor times | ✔️ Same features |
| Composite Profiles | ❌ Not available | ✔️ Multi‑session composite profiles with reset by Day, Week, Month, or Custom; width & opacity controls |
| Live Profiles | ❌ Not available | ✔️ Real‑time updating profiles with auto‑clear and opacity control |
| General Settings | ✔️ Profile bins (ATR, Noise, Custom, Points), Profile input (Volume, Time, VolumeTime) | ✔️ Adds Custom Period, advanced inputs (Delta, DeltaVolume, VolumeDensity) |
| Styling & Labels | ✔️ Branding toggle | ✔️ Adds Profile Shape Name and Commentary Text |
| Alerts & Signals | ❌ Not available | ✔️ Voice alerts (POC, VAH, VAL, LVN, HVN), custom texts, commentary playback, chart signals, signal variance, multi‑session logic |
| Granularity | ✔️ Secondary Bars Type & Value | ✔️ Same features |
🚀 Why Upgrade to Pro?
- Unlock Composite Profiles for long‑term institutional zones.
- Use Live Profiles for real‑time scalping context.
- Get advanced inputs like Delta and VolumeDensity.
- Automate your trading workflow with voice alerts and chart signals.
- Add commentary and shape names for deeper auction‑theory insights.
📊 Volume Profile – Features & Guide
1. Plot Colors
What it does: Controls the visual styling of profiles and levels. Why it matters: Clear colors help you instantly distinguish bullish vs bearish volume, balance edges, and rejection zones.
- Bin Fill & Outline Colors (Up/Down)
- POC, VAH, VAL Colors & Widths
- Value Area Delta Colors (+/–)
- Bin POC Color
- Label Text Color
- Fill Opacity
2. Plot Styling
What it does: Defines the color and thickness of key auction levels. Why it matters: Strong visual emphasis on POC, VAH, VAL makes them easy to track in real time.
- POC Color + Line Width
- Low Value Color + Line Width
- High Value Color + Line Width
3. Display Settings
What it does: Controls how profiles and labels are drawn. Why it matters: Keeps your chart readable and professional.
- Profile Width (Session & Composite)
- Label Sizes (Profiles, Signals Pro, Commentary Pro)
- Value Area toggle
- POC/VAH/VAL Labels & Plots
4. Session Profiles
What it does: Resets profiles at defined anchor times. Why it matters: Isolates intraday phases to capture institutional flows.
- Draw Session Volume Profile
- VP Anchor Times (1–5)
5. Composite Profiles (Pro)
What it does: Aggregates multiple sessions into one long‑term profile. Why it matters: Reveals macro acceptance zones and institutional footprints.
- Reset by Day, Week, Month, or Custom
- Custom Reset Time
- Profile Side, Width, and Opacity
6. Live Profiles (Pro)
What it does: Continuously updates profiles as each bar prints. Why it matters: Ideal for scalpers who need evolving volume context.
- Live Volume Profile toggle
- Remove Old Live Profiles
- Adjustable Opacity
7. General Profile Settings
What it does: Fine‑tunes how profiles are calculated. Why it matters: Gives you control over precision and balance.
- Profile Custom Period (Pro)
- Profile Bins (ATR, Noise, Custom, Points)
- Profile Custom Bins
- Profile Input (Volume, Time, VolumeTime, Delta, DeltaVolume, VolumeDensity)
- Value Area %
8. Styling & Labels
What it does: Adds branding and commentary. Why it matters: Keeps your chart professional and informative.
- Branding toggle
- Profile Shape Name (Pro)
- Analysis Text (Pro)
9. Alerts & Signals (Pro)
What it does: Turns levels into actionable trade alerts. Why it matters: Never miss a critical touch.
- Voice Alerts → Spoken notifications for POC, VAH, VAL, LVN, HVN
- Custom Alert Texts → Personalize your alerts
- Play Commentary / VP Commentary Text → Auction‑theory notes
- Signal Arrows → Chart markers at level interactions
- Signal Variance → Adjust sensitivity
- Multi‑session logic → Alerts extend to prior levels (POC1, POC2, etc.)
10. Granularity
What it does: Defines how volume is sampled. Why it matters: Adjusts detail vs smoothness to match your trading style.
- Secondary Bars Type (seconds, ticks, minutes, etc.)
- Secondary Bars Value , ie 1 , 5
📖 The Quick Start Guide to Trading with Volume Profile
🔍 What is Volume Profile?
- Definition: A horizontal histogram showing traded volume at each price level.
- Why it matters: Reveals where the market agreed on value, not just when it traded.
- Core Components:
- POC → Highest volume price, the “fair value magnet.”
- VAH/VAL → 70% volume zone boundaries, dynamic support/resistance.
- HVN → Acceptance shelves, consolidation zones.
- LVN → Rejection gaps, breakout paths.

📊 Profile Types
- Session Profile → One trading day, intraday setups.
- Visible Range → Based on chart view, flexible for discretionary analysis.
- Fixed Range → User‑defined event window, ideal for swing trades.
- Composite Profile → Aggregates multiple sessions, long‑term zones.
🧠 Auction Market Theory
- Markets are continuous auctions seeking fair value.
- Acceptance → High volume = consensus.
- Rejection → Low volume = unfair price, fast moves.
- Profiles visualize this negotiation, showing institutional footprints.
📐 Profile Shapes
- D‑shape → Balanced, range trading.
- P‑shape → Short squeeze, bullish continuation.
- b‑shape → Long liquidation, bearish continuation.
- B‑shape → Double distribution, two peaks separated by LVN.
🔑 Interpreting Node Positioning
- POC above HVN
- Market’s “fair value” sits higher than the main acceptance cluster.
- Suggests buyers pushed value upward; bullish bias if price holds above HVN.
- POC below HVN
- Fair value is lower than the acceptance cluster.
- Indicates sellers dragged value down; bearish bias if price holds below HVN.
- LVN above HVN
- Thin rejection zone sits above a heavy acceptance area.
- Often acts as resistance: price may bounce off LVN and return to HVN.
- LVN below HVN
- Thin rejection zone sits below acceptance.
- Often acts as support: price may bounce off LVN and return to HVN.
- POC above LVN
- Fair value is above a rejection zone.
- Market rejected lower prices and established value higher → bullish structure.
- POC below LVN
- Fair value is below a rejection zone.
- Market rejected higher prices and established value lower → bearish structure.
⚙️ Trading Strategies
- Breakout Confirmation → Price leaves Value Area with volume expansion.
- Rejection Trades → Price touches LVN and reverses.
- HVN Retracements → Price gravitates back to HVNs.
- Multi‑Timeframe Confluence → Align session profiles with composite zones.
📊 Success Statistics
- CME Group (2022) → VP strategies on E‑mini S&P 500: 59% win rate, 1.9:1 reward‑to‑risk.
- Sierra Chart (2021) → VP entries outperformed classic support/resistance by +2.1% per trade.
- Tradamaker (2020) → Price respected VAH/VAL as S/R 65% of the time.
- Prop trader FRVP (2025) → Reported 68–75% win rates using Fixed Range VP.
- Day trading stats (2026) → Systematic VP strategies with risk controls: up to 66% win rates.
⚠️ Risks & Pitfalls
- Data quality → Tick‑level feeds required; aggregated volume distorts profiles.
- Retail misuse → Treating VP as static support/resistance without context.
- Platform differences → NinjaTrader, TradingView, Sierra Chart calculate profiles differently.
- Overfitting → Profiles can be cherry‑picked; disciplined rules essential.
-
⚙️ Trading Strategies with Volume Profile
1. 📈 Breakout Confirmation
Concept: When price escapes the Value Area (VAH/VAL) with strong volume, it signals a shift in consensus.
- Setup:
- Identify VAH/VAL from the current session.
- Watch for price closing outside VAH/VAL with volume expansion.
- Execution:
- Enter in the breakout direction.
- Place stop just inside the Value Area.
- Target next HVN or composite level.
- Stats: CME futures data shows breakout trades from VAH/VAL achieve ~62% win rate with average R:R of 1.8:1.
2. 🔄 Rejection Trades
Concept: LVNs mark rejection zones. Price often tests and reverses at these “gaps.”
- Setup:
- Identify LVN below/above current price.
- Watch for price touching LVN and failing to hold.
- Execution:
- Enter opposite to rejection (long if rejected below, short if rejected above).
- Place stop just beyond LVN.
- Target POC or opposite Value Area edge.
- Stats: Studies show LVN rejection trades respect levels ~65% of the time, outperforming classic support/resistance.
3. 🏛 HVN Retracements
Concept: HVNs are “magnets” — price gravitates back to them after excursions.
- Setup:
- Identify HVN shelf from current/composite profile.
- Watch for price moving away and then retracing.
- Execution:
- Enter on return to HVN.
- Place stop just beyond HVN shelf.
- Target opposite Value Area edge.
- Stats: Backtests show HVN retracements yield ~59% win rate, but with high R:R (2.2:1).
4. 🧩 Profile Shape Strategies
Concept: Profile distribution shapes (D, P, b, B) reveal market context.
- D‑shape (Balanced) → Range trading. Fade extremes, target POC.
- P‑shape (Short squeeze) → Bullish continuation. Buy VAH breakouts.
- b‑shape (Long liquidation) → Bearish continuation. Sell VAL breakdowns.
- B‑shape (Double distribution) → Two trading ranges. Trade between peaks, avoid LVN gap.
5. 🕰 Multi‑Timeframe Confluence
Concept: Align intraday profiles with composite levels for higher probability.
- Setup:
- Plot session profile + composite profile.
- Look for overlapping HVNs/LVNs.
- Execution:
- Trade only when intraday signals align with composite zones.
- Stats: Prop desk data shows confluence setups improve win rate to ~70% with R:R near 2:1.
✅ Key Takeaways
- Breakouts → Trade VAH/VAL escapes with volume.
- Rejections → Fade LVNs as rejection zones.
- Retracements → HVNs act as magnets.
- Shapes → Adapt strategy to D/P/b/B context.
- Confluence → Align intraday with composite for best results.
- Setup: