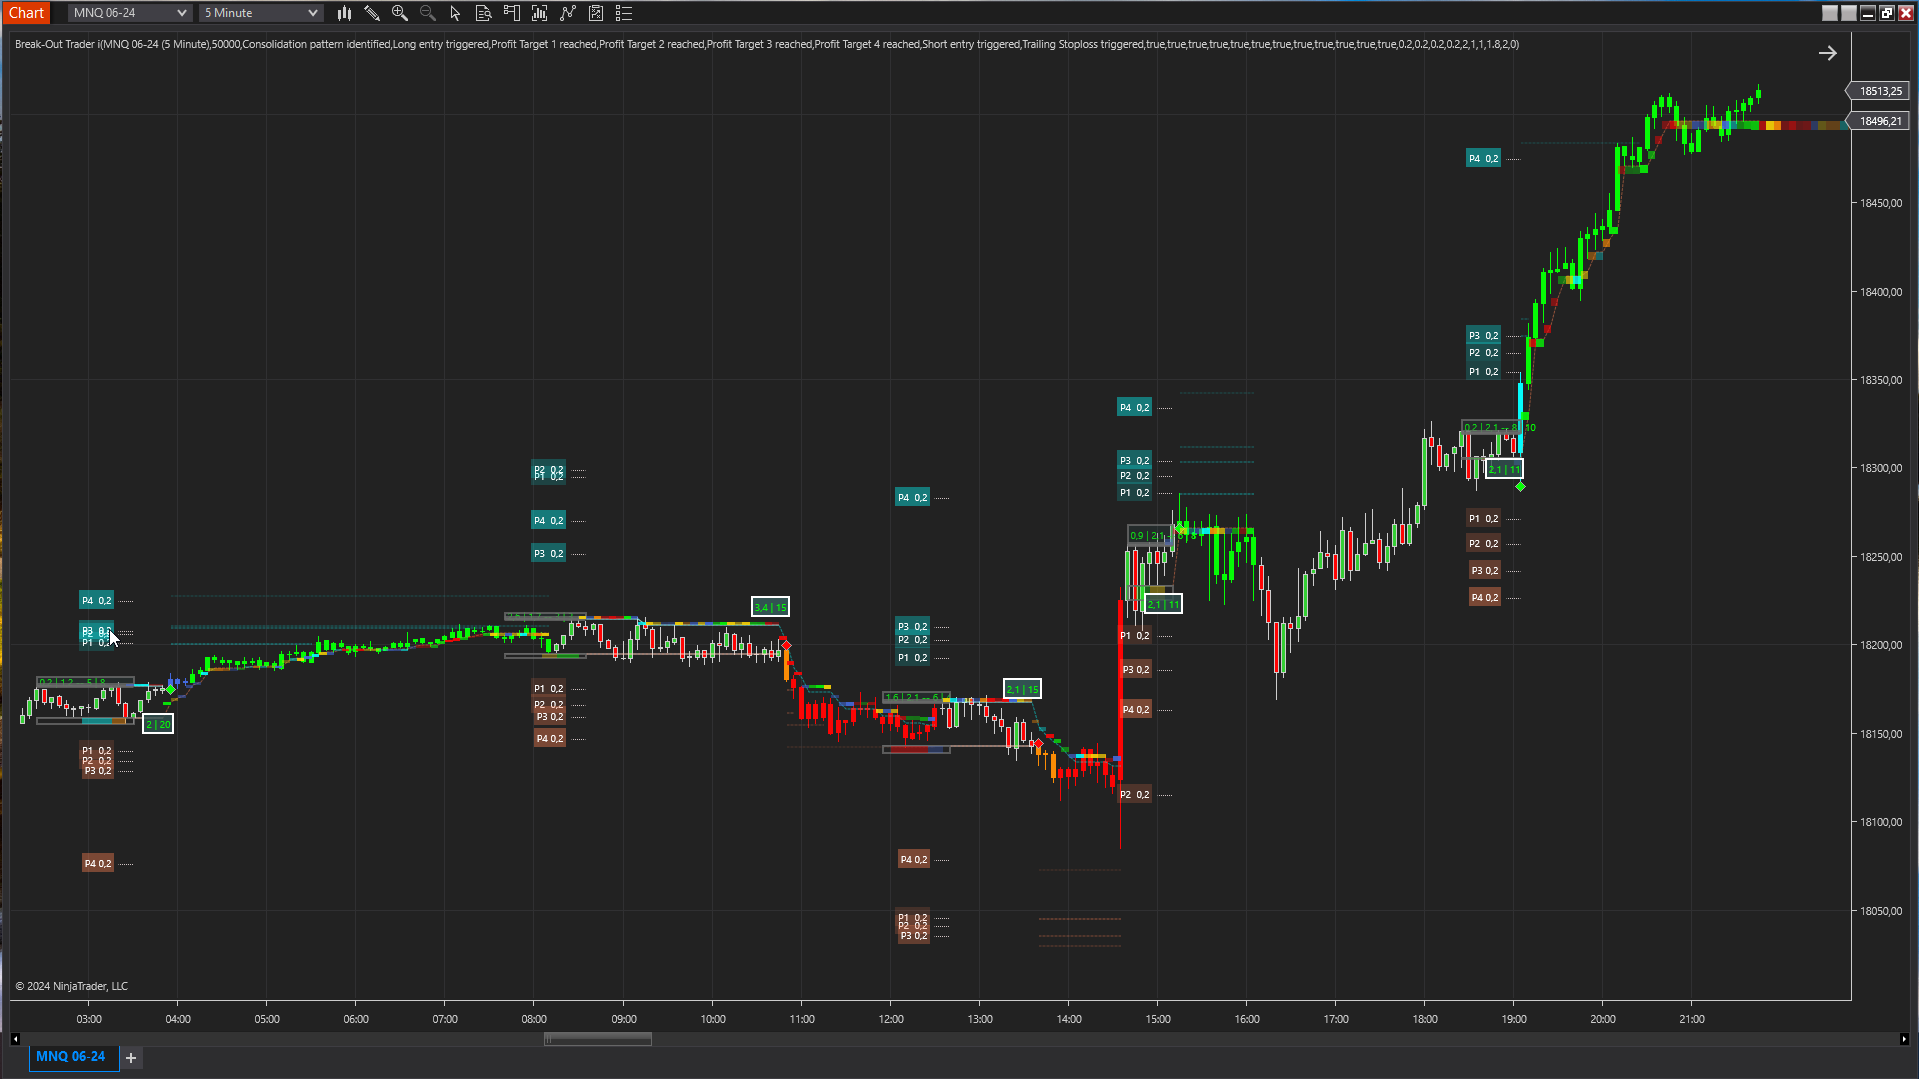
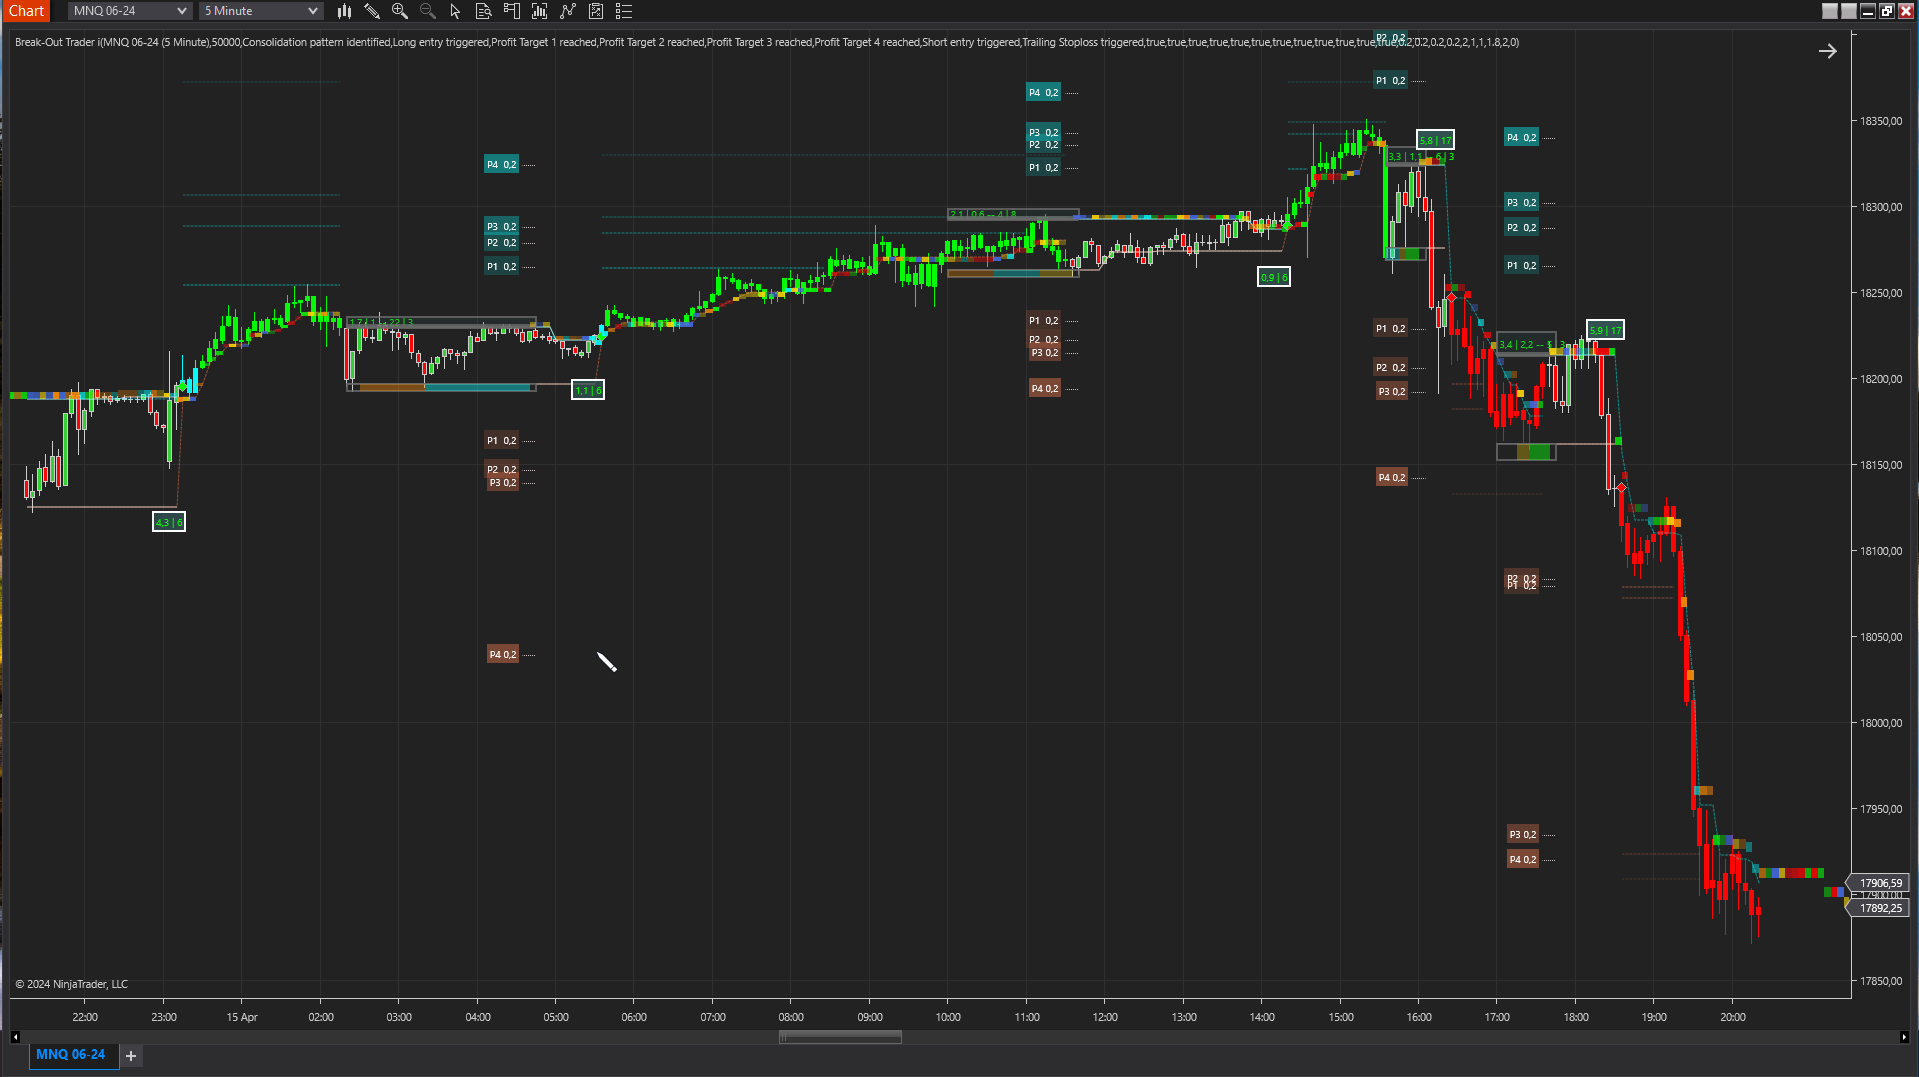
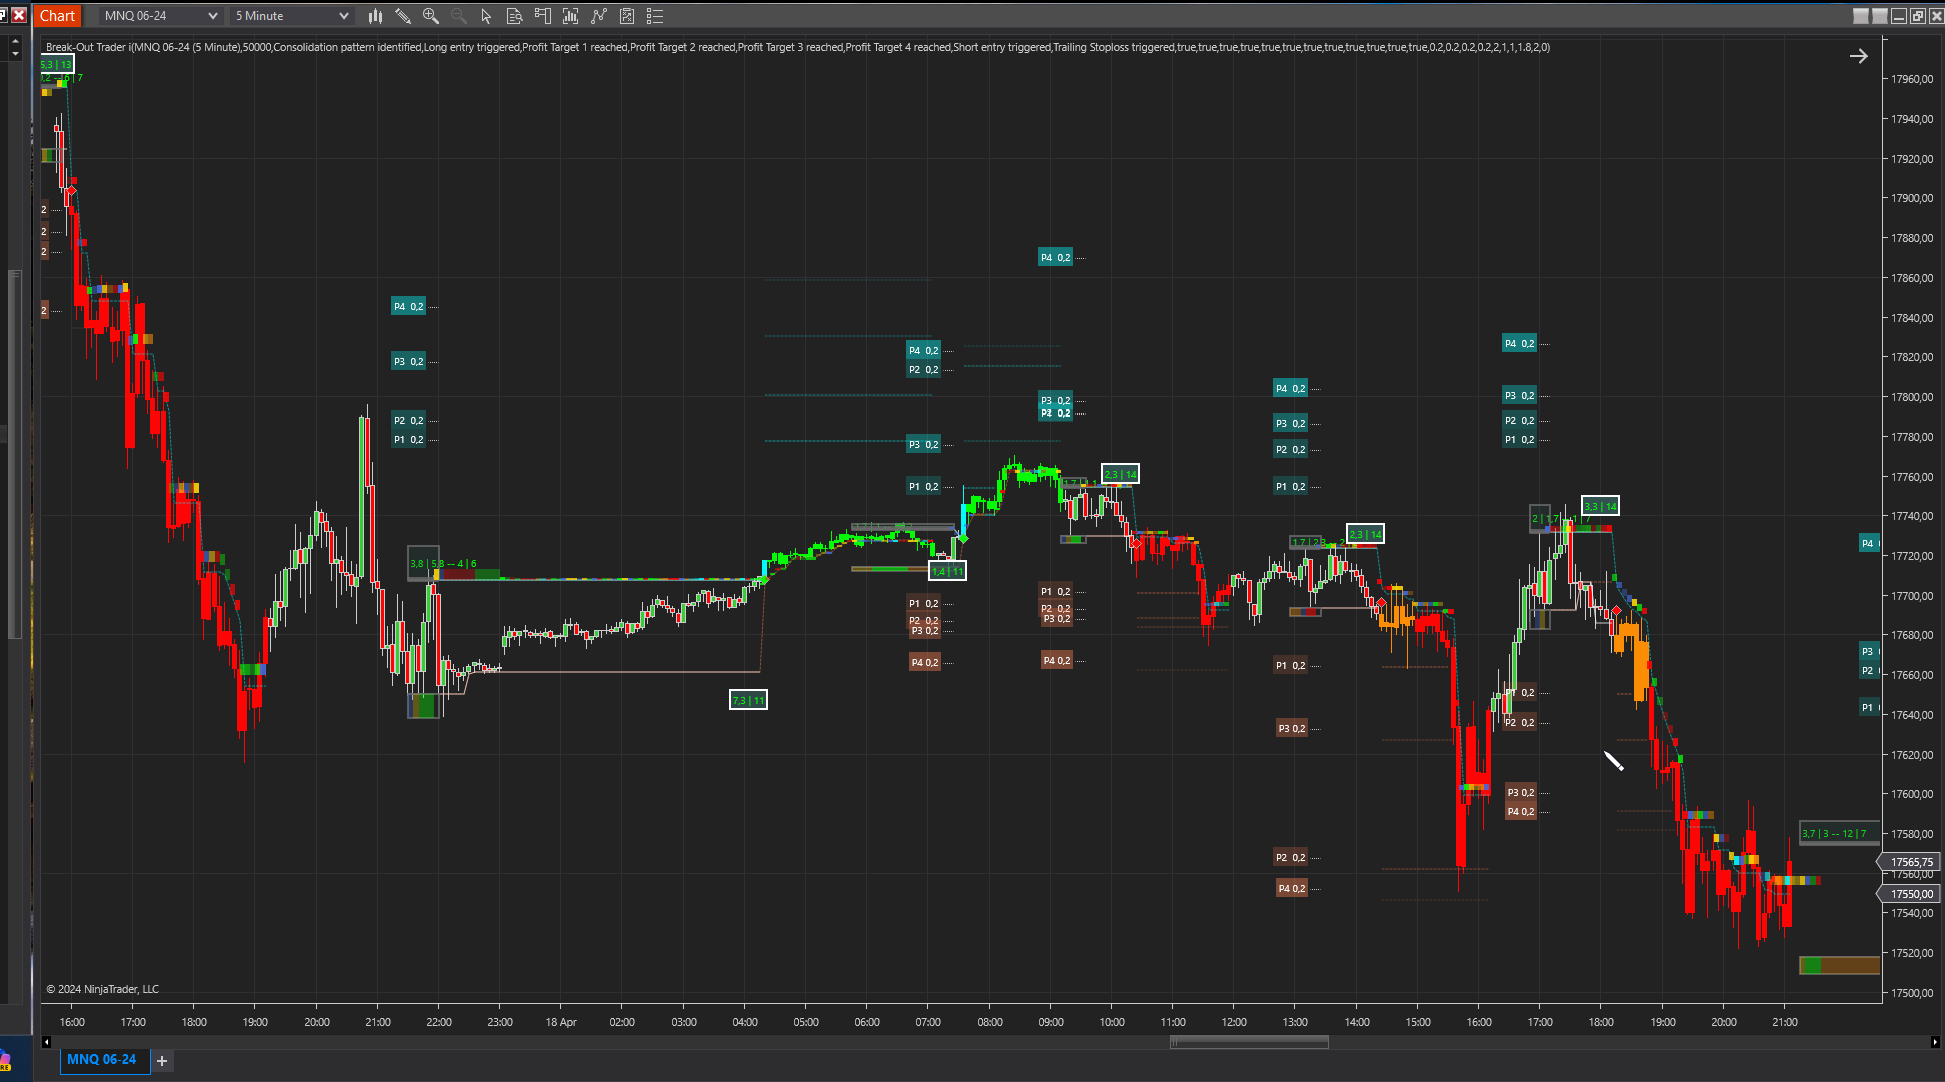
Introduction to Break-Out Trader:
In financial markets, price movements oscillate between two primary states: consolidation and expansion. These phases play a crucial role in determining market dynamics. These setups consistently produce great trade setups for the beginner as well as the experienced trader.
Consolidation (Accumulation): During consolidation, an asset’s price moves within a relatively narrow range. This phase reflects a temporary equilibrium between buyers and sellers. Traders often refer to it as the “accumulation” phase because market participants are gathering positions before the next significant move.
Breakout Opportunities: After a period of consolidation, the market tends to break out in one direction. A breakout occurs when the price escapes the range and establishes a new trend. These breakout moments present exciting opportunities for traders to capitalize on price momentum.
We have developed this powerful indicator called breakout trader to capitalize on these great trade setups!
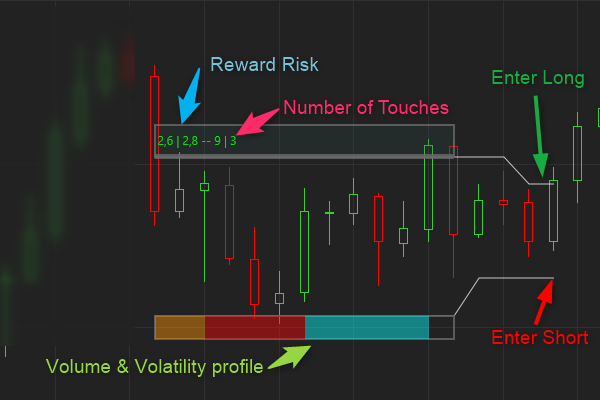
When a Consolidation pattern is identified:
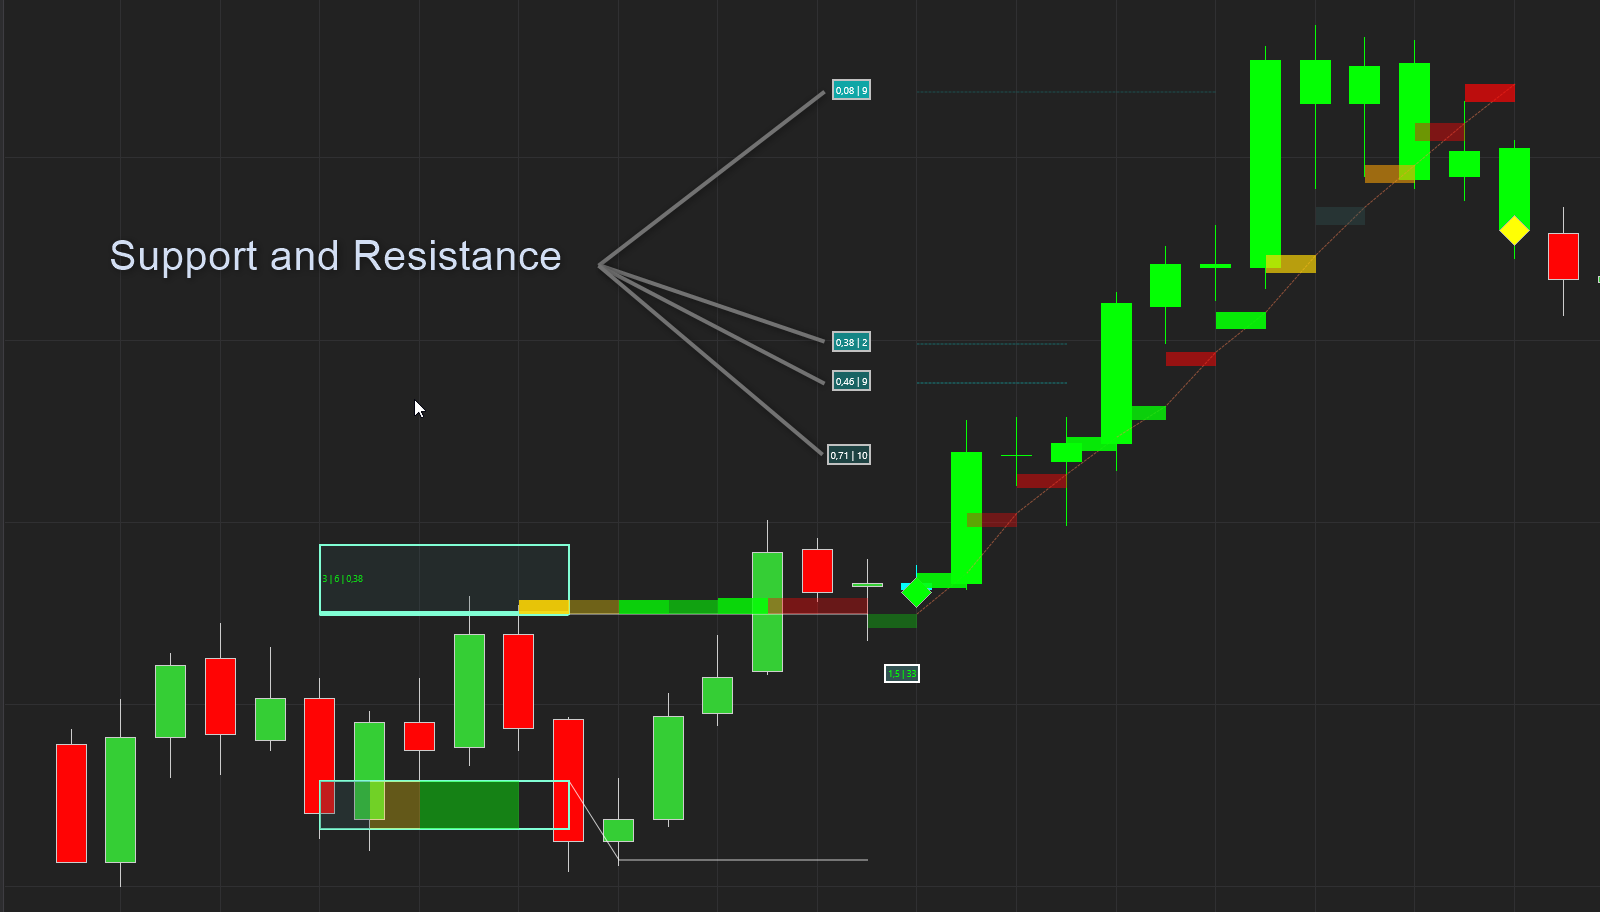
- The indicator plots the support and resistance levels.
- It calculates and displays the reward to risk ratio for both a potential long and short breakouts. These ratios are calculated based on the trailing stoploss level and the potential profit targets. More on this later..
- We also plot the number of times the price has touched the support and resistance levels. These values are very helpful in showing us how often the support or resistance level was tested during this consolidation.
Break-Out Trader : Heat
Unfortunately false breakouts occur more often than we would like. This is simply a cost of trading and we have to live with it. Changes in volume and volatility are metrics that we can use to help us a void false breakout to a large extent so we have developed a “heat” indicator to show us these changes and help us trade break outs better.
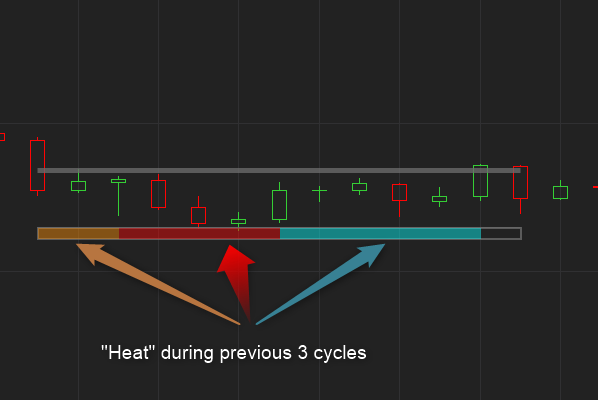
When the pattern is identified the indicator plots the “heat ” at the support level. This heat represents the volume and volatility heat during the past 3 cycles of the consolidation. This helps us see the pattern of the money flow during the period.
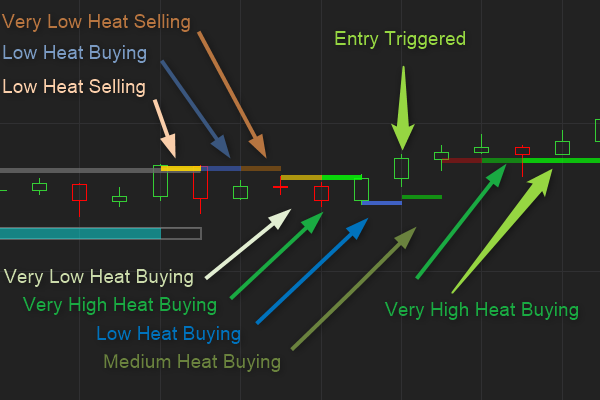
The indicator then continues to plot the heat at the trailing stoploss level until the trade is completed. This is really invaluable in showing us how the buying shifts to selling and vice versa during a trade and in the build up to a trade entry.
Break-Out Trader: Entry levels
Initially the long entry and short entry levels are the resistance and support levels respectively. We adjust these levels close if the the consolidation becomes “tighter”.

Break-Out Trader : Profit Targets
Below are 2 videos demonstrating some great trades from the past week.
The indicator has 4 different methods or algorithms to calculate Profit Target levels with.
It calculates 4 distinct levels and calculates the probability of each level being hit.
These probabilities are calculated based on previous trades that the system has completed. This is very useful as it gives us a far better idea of how the profit targets performed in the past and also how much of our position to exit at each level.
We use Probability Law to vastly improve our exits…
The 4 Profit Target methods are :
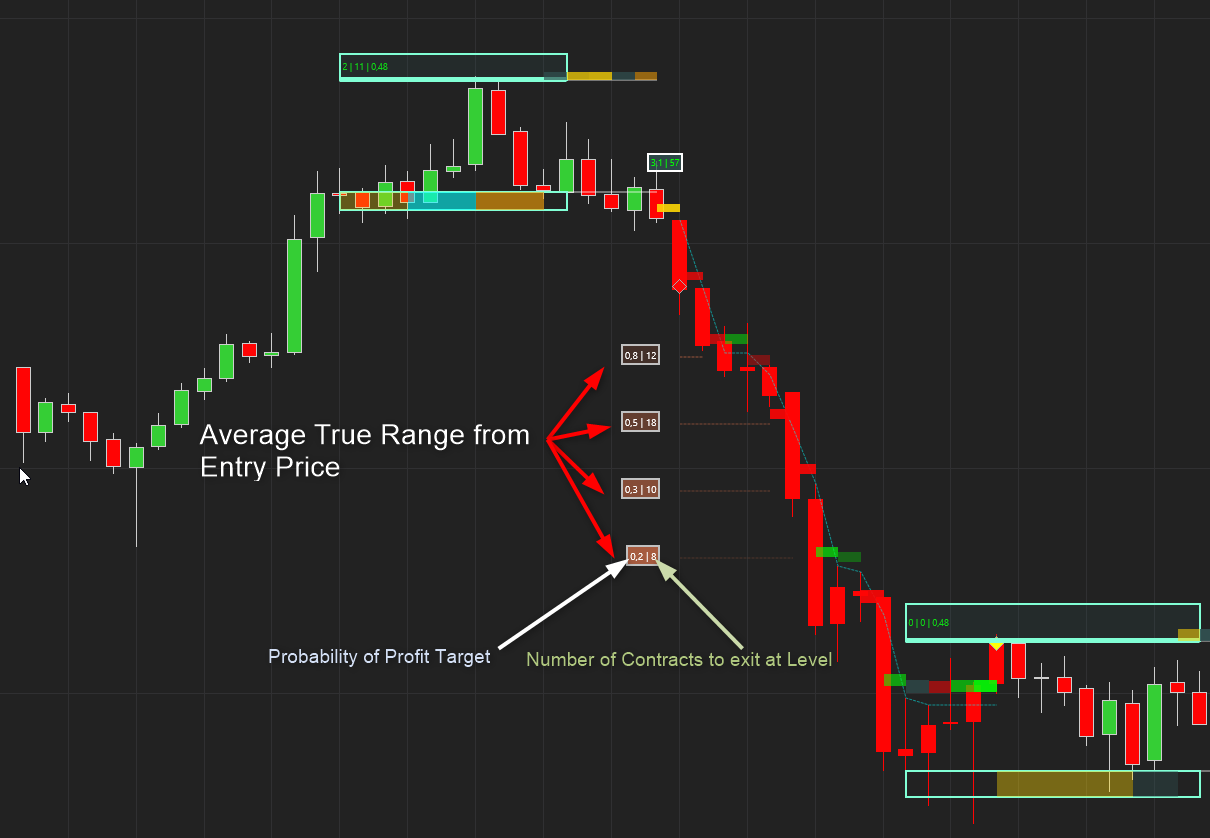
Average True Range
This Profit Target method calculates 4 PT levels from the entry price based on the number of ATRs that you specify.
It also shows the probability or the number of times that this level was reached before. It shows you the number of contracts to exit based on your initial position and the level’s probability.
Support and Resistance
Fibonacci levels
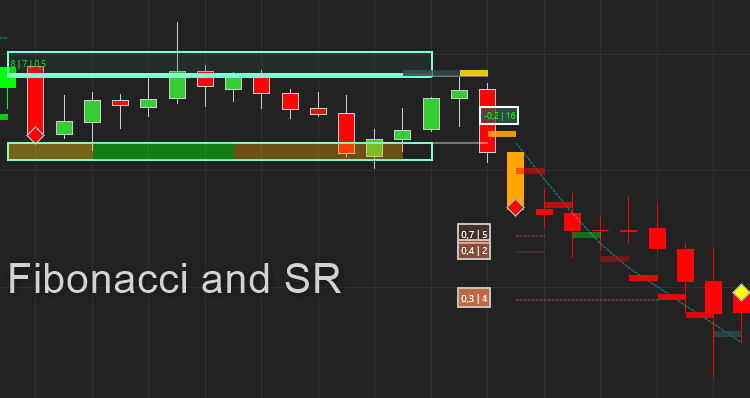
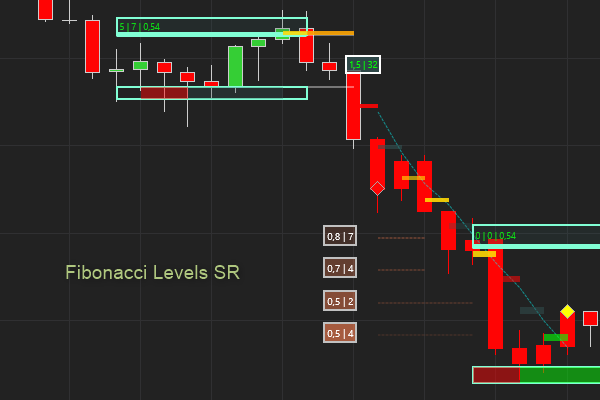
Fibonacci and SR Levels
Break-out Trader Update explained
Trailing stoploss / Risk levels
Break-Out Trader has 6 different Trailing Stoploss methods to use in your strategy. It has all these options so that we can apply different methods to a scalping or a trending strategy or define your own strategy.
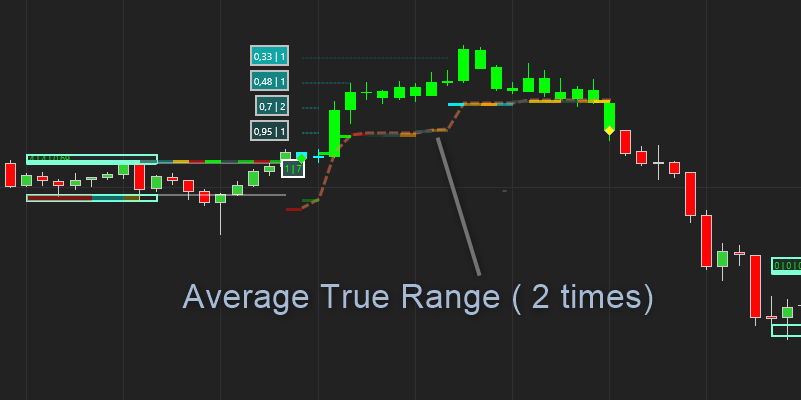
Average True Range
This method simply trails the stoploss by the Average True Range that we set. It trails this tsl from the maximum point in the trade. You can set the value of the ATR.
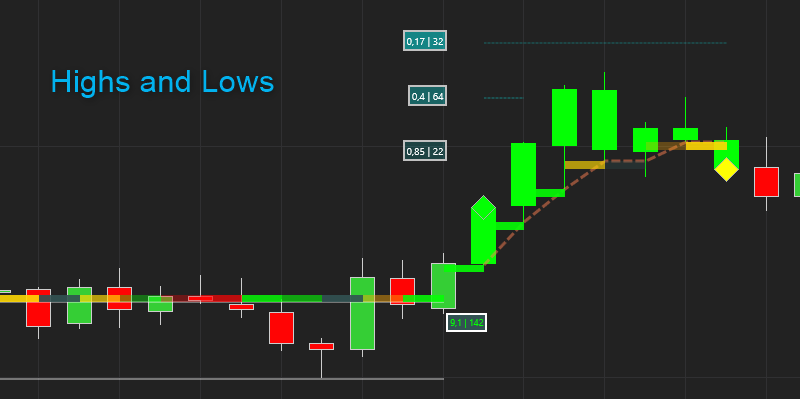
Highs and Lows
This method trails the tsl with the Lows(Longs) and Highs (shorts). You can also define an offset in ATRs to trail below or above the tsl.
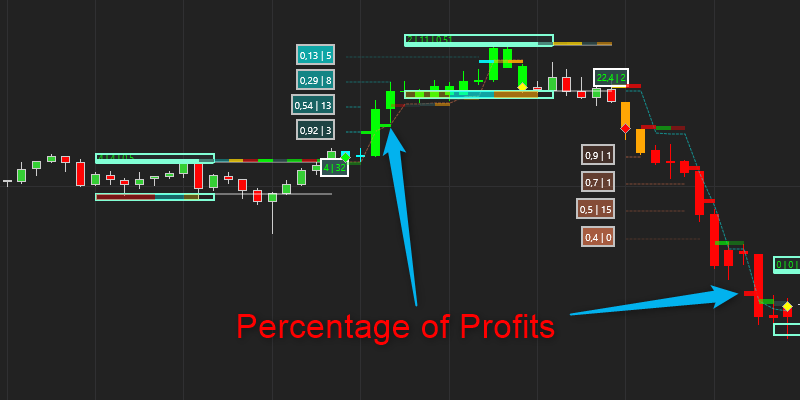
Percentage of Profits
Here the tsl trials with the maximum price and aims to protect your profits by limiting the loss to a percentage of the profit gained in the trade. The question now becomes, what percentage? Well, since we measure the probability of the profit targets we can use these percentages for this equation. Example, if the PT2 probability is 50% then we know that there is still a 50% chance that the price can go higher, thus we trail the tsl to risk 50 % of the profit when it reaches this level. When the price gets to PT4 and the probability is 20%, there is only a 20% chance that price will go higher and this we set it to risk 20 % at this level
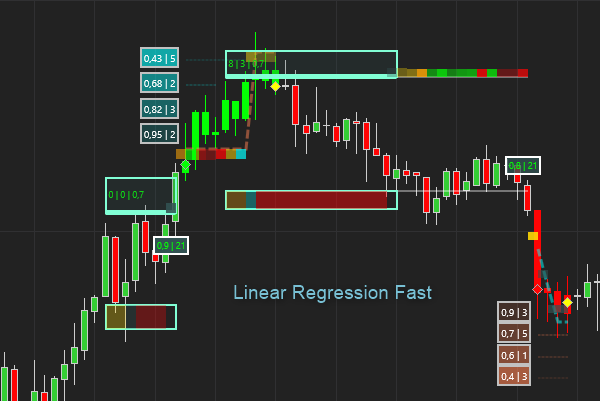
Adaptive Linear Regression
This TSL uses “Linear” Regressions that adapt with time and volatility to find a very fast tsl. This method is best suited for scalping strategies as it exits quickly at the first sign of the trend breaking down.
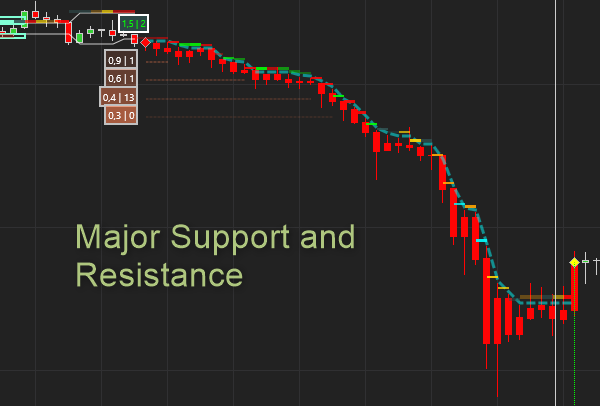
Support And Resistance
It makes sense to use SRs in trailing Stoplosses because when the market goes above a Resistance, then this becomes support and the tsl adapts to this support line. This method also incorporates newly created intra-bar volume Support and Resistances. This is a slower tsl and better suited to strategies that want to ride longer trends.

SR_LR Hybrid.
Here we combined all the “goodness” of the Linear Regressions and Support / Resistance methods in to a Hybrid model, It aims to be faster than the Linear Regression method but slower than the SR Method.
Templates: Putting it all together…
We have created 2 templates combing PTs and TSLs in a way that’s best suited to either a Trending or Scalping trading style. Feel free to create your own templates that works best for you.

Scalping:
This template uses the ATR PT method and combines it with the SR_LR Hybrid. The reason is that for a scalping strategy we need fast exits, That means small profit targets and a tight trailing stoploss. We also set the Profit target setting to a low value (0.3) as we are scalping for smaller and more regular profits With these settings we expect the strategy to have a high win to loss ratio, say 60% or more.

Trending:
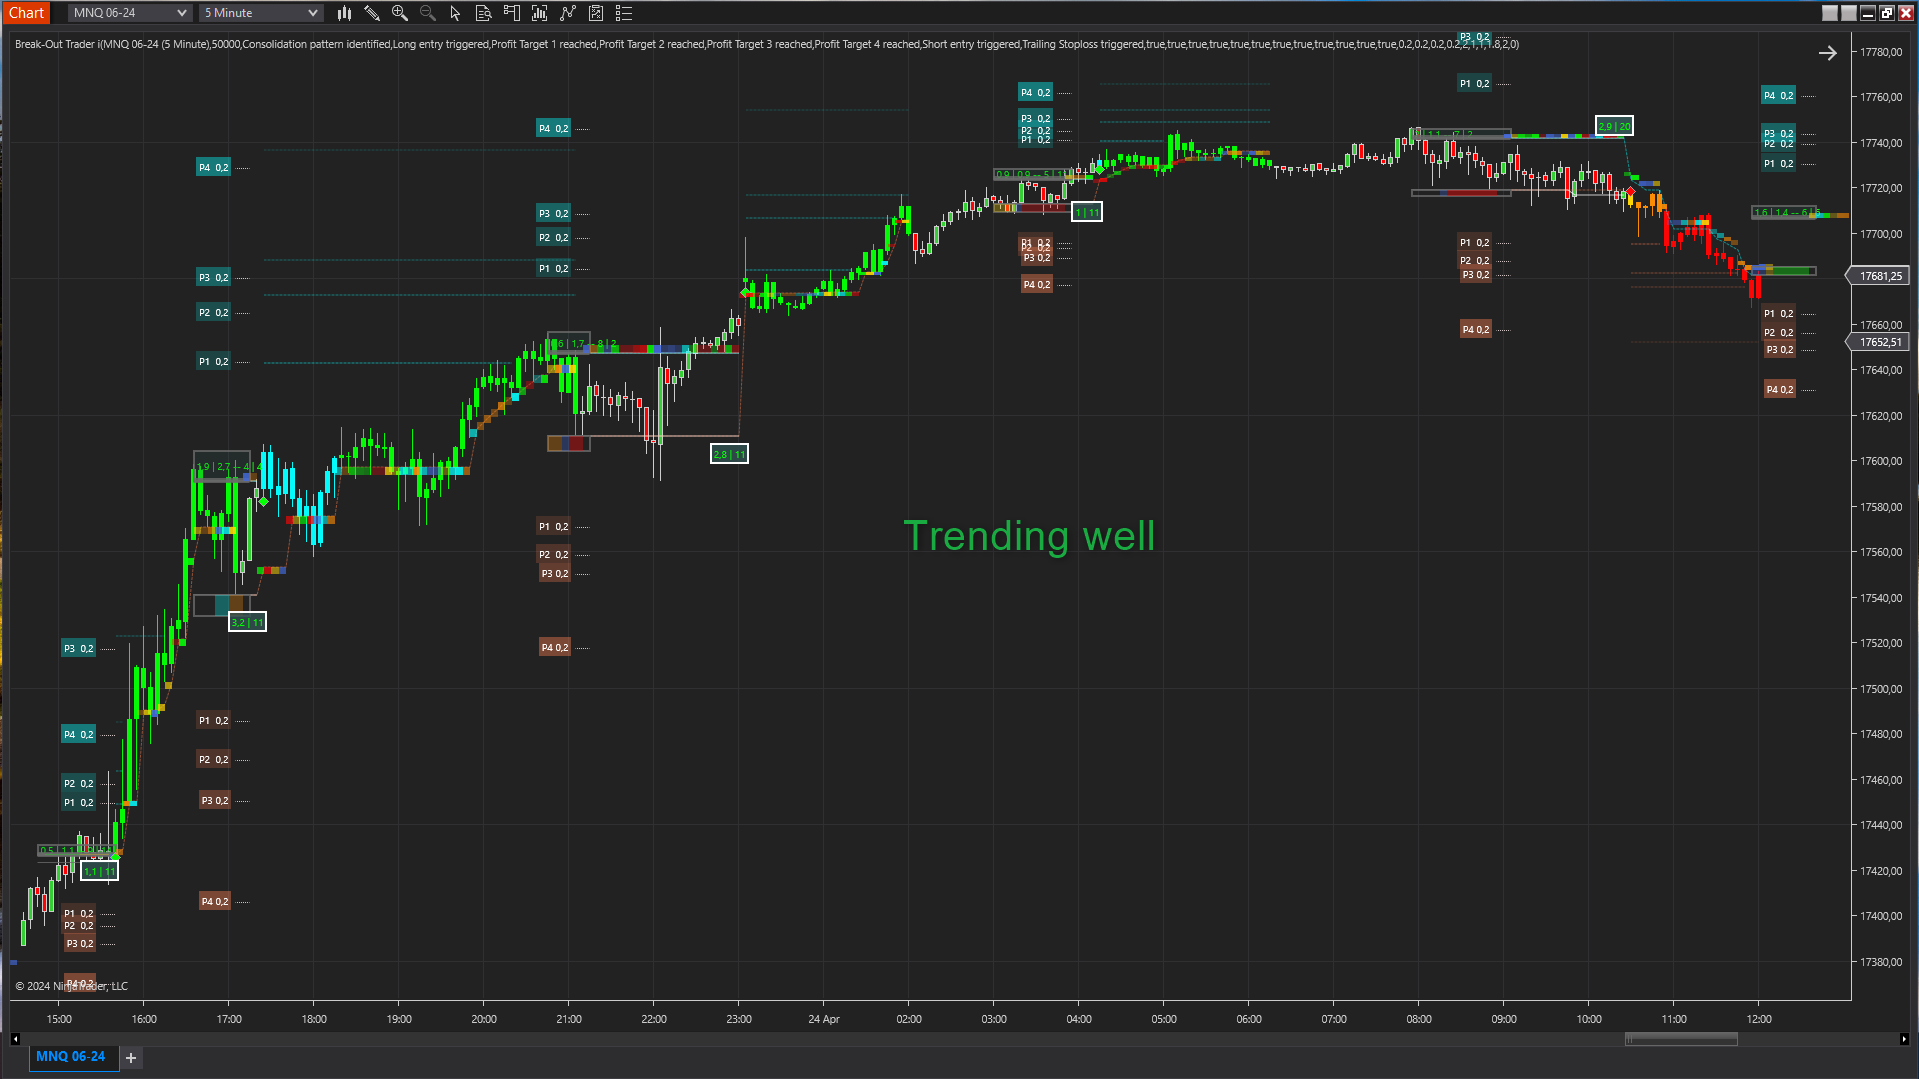
This template uses the SR template for profit targets and the SR template for trailing stoplosses Here we want slower exits which allow the trade to develop fully so that the profits can be bigger. We also need bigger Profit Targets to ride more of the profits and so we set the Profit Target Setting to 0.5 or higher. You will find that setting the Profit Target setting lower (0.2 -0.4) will increase the success rate, more trade will be winners but it comes at a cost of leaving profits on the table. The aim is to maximise the balance between these two.
Reward and Risk
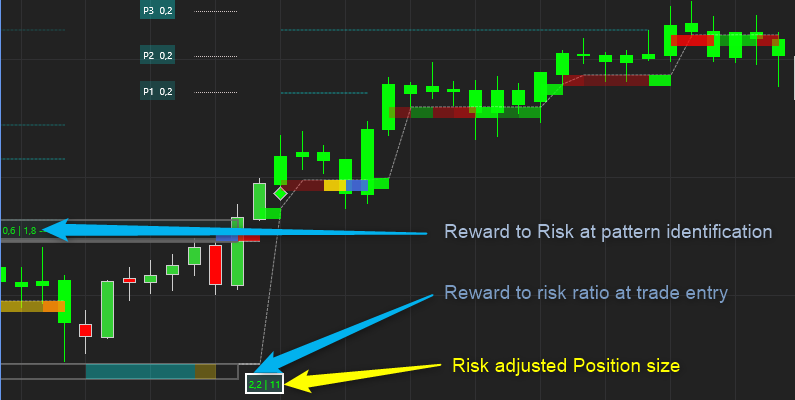
Break-Out trader calculates the potential risk and reward when the pattern is identified. It recalculates this when an entry is signaled since by this time the price has moved beyond the entry level and the risk reward diminishes the farther the price moves from the entry level. The volatility and SR levels might have changed as well since the pattern was identified
We use a weighted probability between profit target levels and trailing stoploss line to calculate the Reward to Risk ratio.
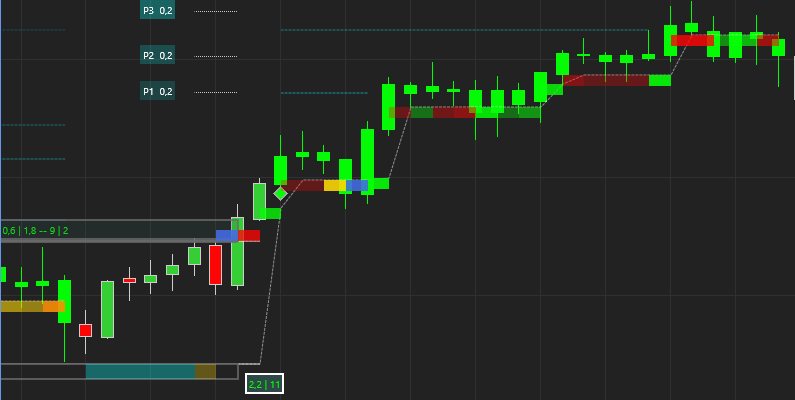
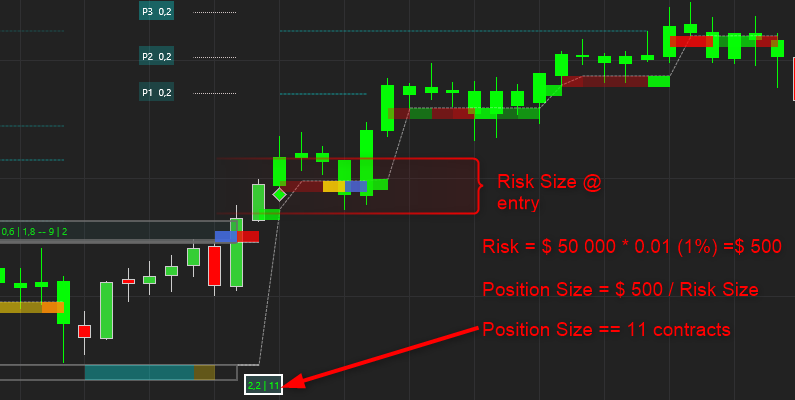
Risk Management and Position Sizing
This indicator allows you to set your desired risk % to risk per trade. You simply define your account size and risk tolerance % in the user interface. The indie will then display the number of contracts to trade to risk no more than the set risk %. This is calculated based on the trailing stoploss level determined by the indicator
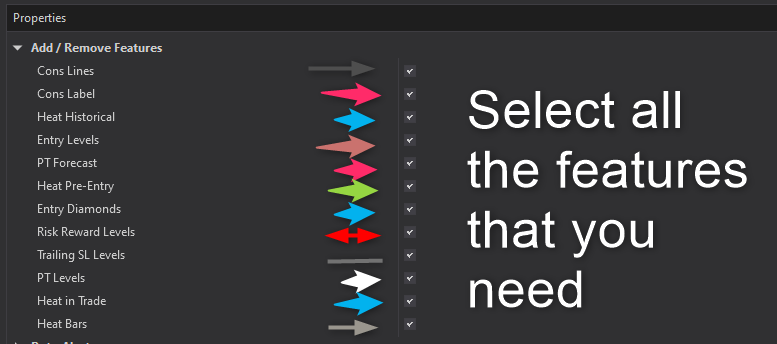
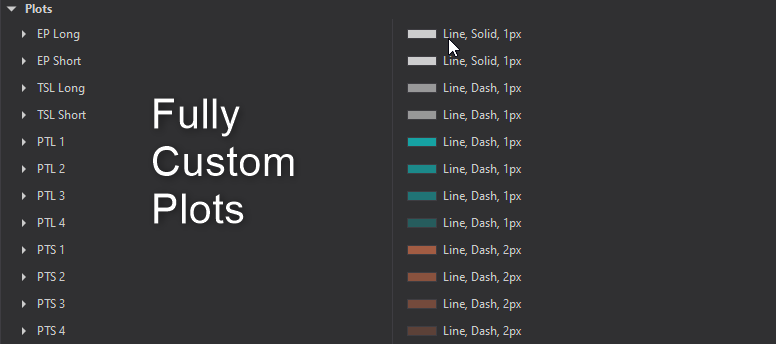
Fully Customizable
There are many features in this tool but you don’t have to use all of them. Select only what you need to use.
All the plots can be customized.
Works well on all instruments.
Works on all timeframes.
Break-Out Trader in Action
Strategy Development
We are busy testing and developing this indicator as a strategy. Although we still have a lot of research to do it certainly looks very promising.
We still have to spend and a lot of time and money on testing and development before we can offer this to you.
You are welcome to develop your own strategies with this indicator. All the plot values are accessible to you to use in your own code!
More Images
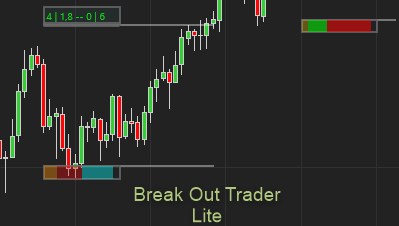
2 Options Available:
Break-Out Trader Lite
Break-Out Trader Pro
