CBO
Advanced Pattern and Breakout Detection
Identify breakout zones early, manage risk with precision, and trade with confidence
Features
- Consolidation Patterns
- Point of Control
- High Volume Nodes
- Profit Targets / SR
- Chart Patterns
- TrendLines
- Cumulative Delta
- Anchored VWAP
- Intra Bar Heat
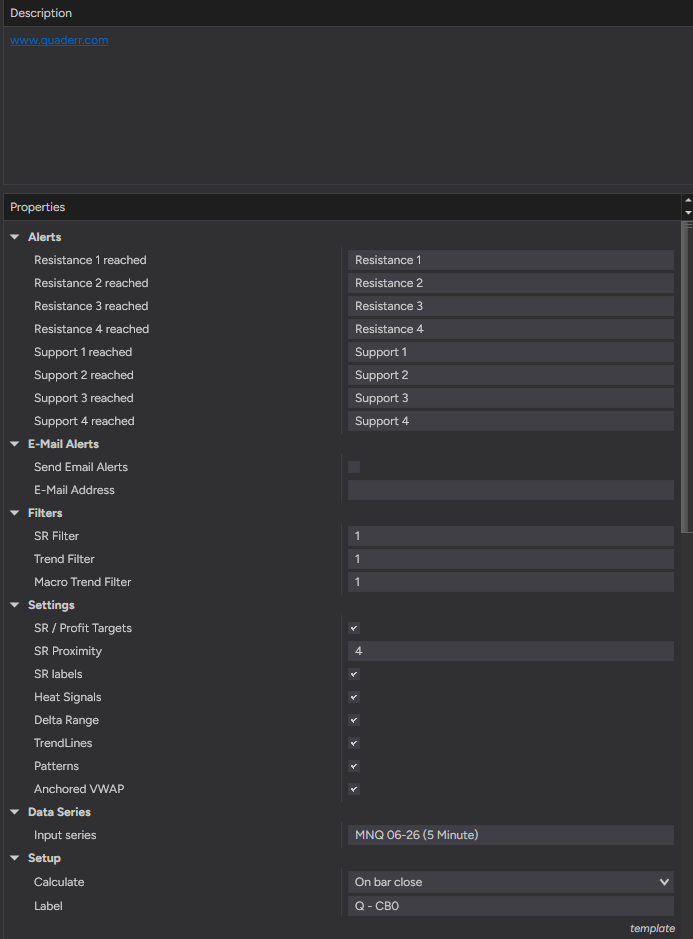
- Alerts
- Email Alerts
- Works on All Instruments
- Works on All Timeframes
Trade Set-Ups
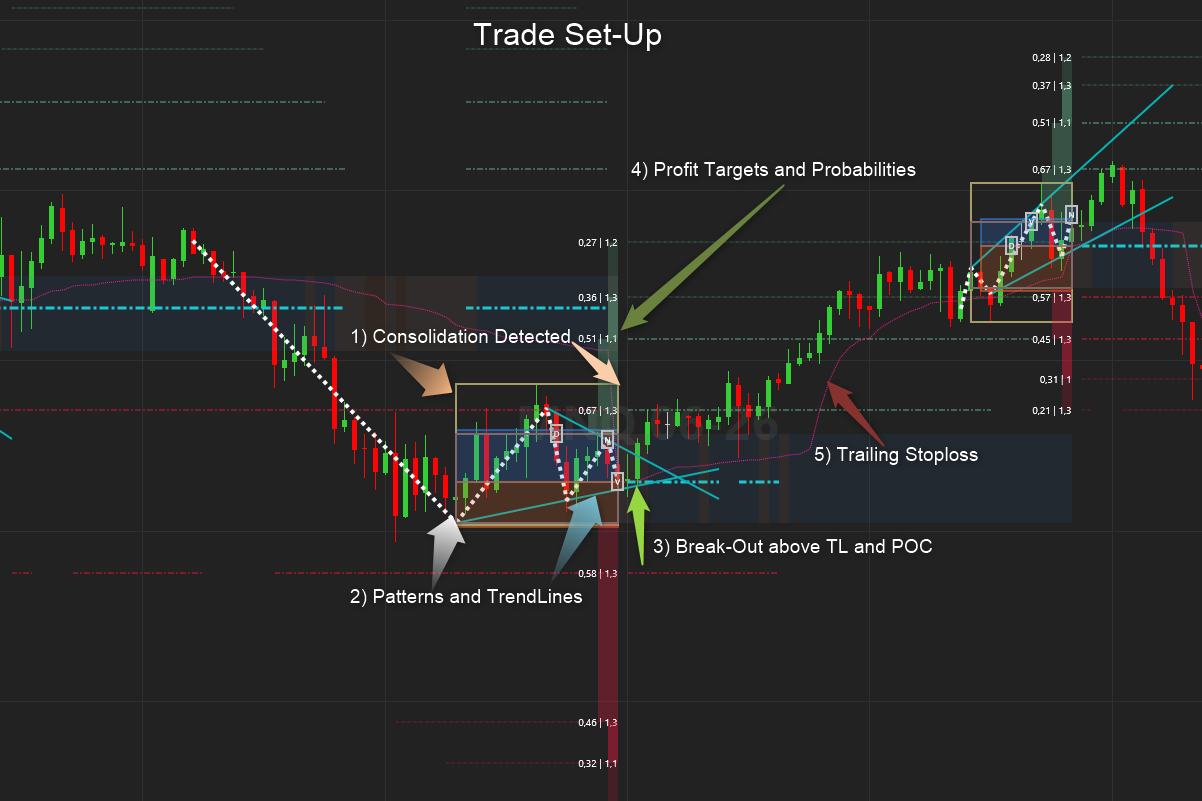
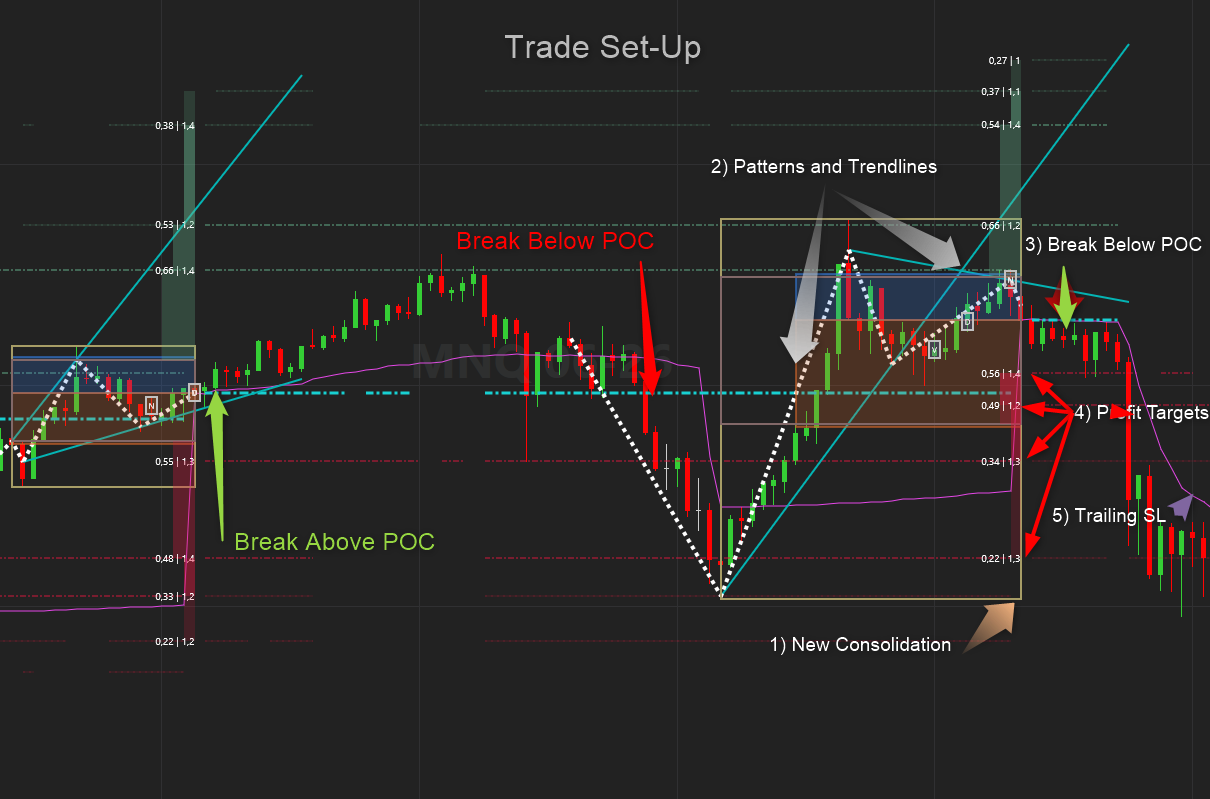
Consolidation Patterns – Define the Trade Set-Up
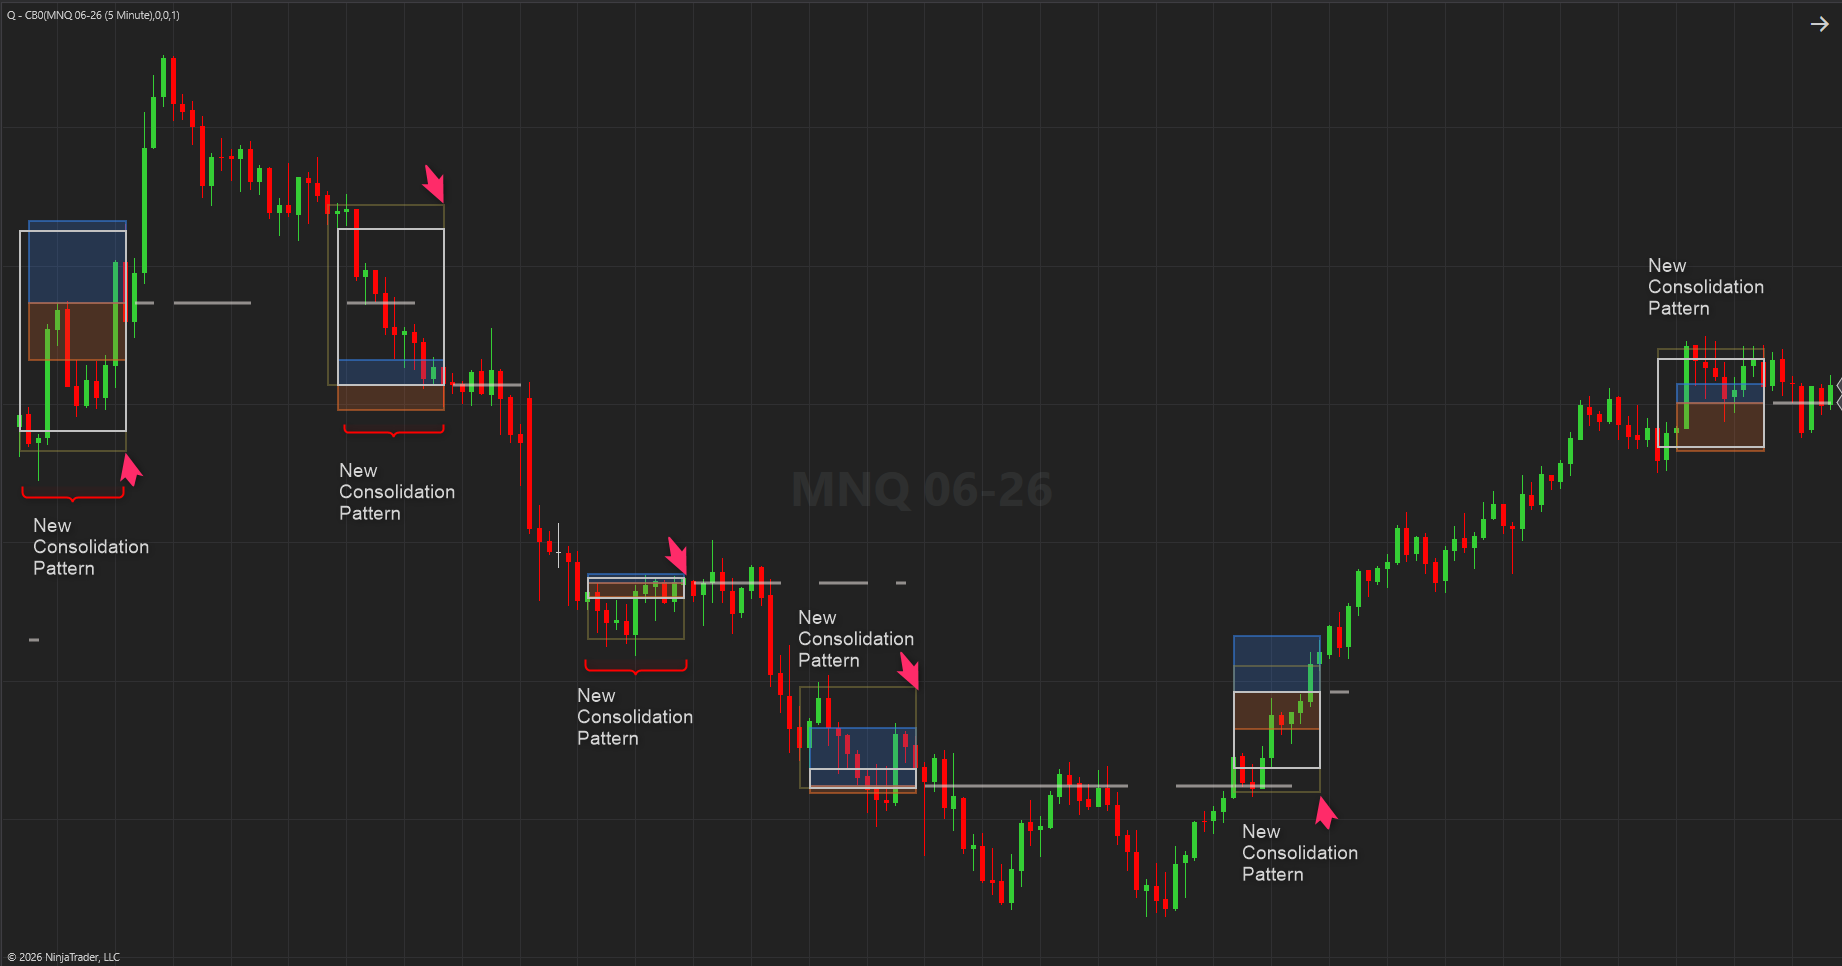
The market moves in phases from consolidation to expansion and back again. This indicator aims to capture the consolidation phases and then exploit or capture the expansion that follows.
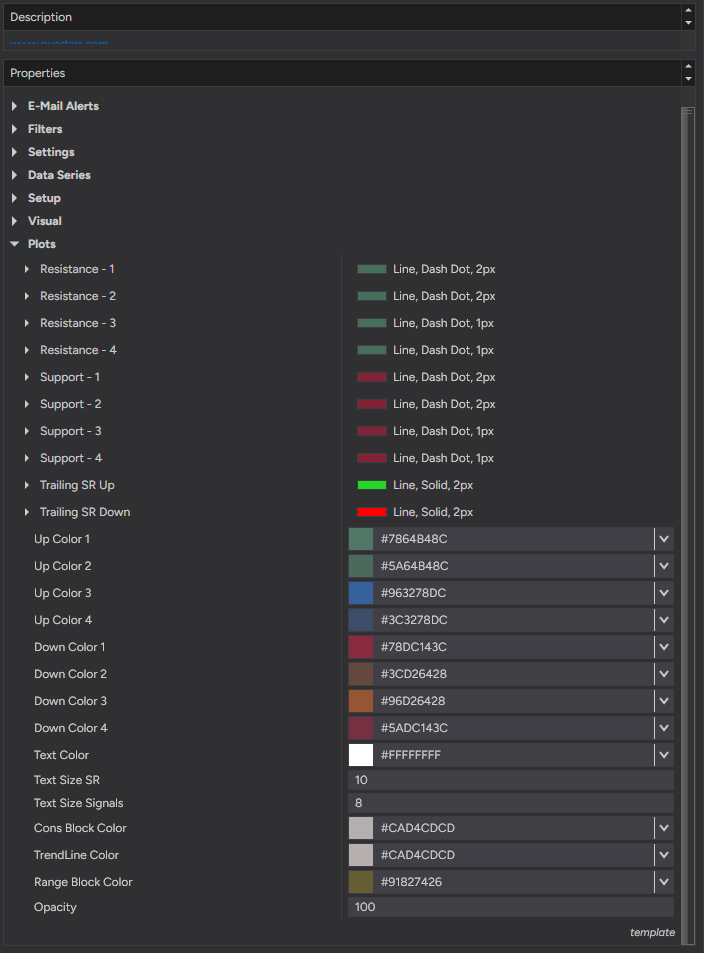
Key to CBO
How it works
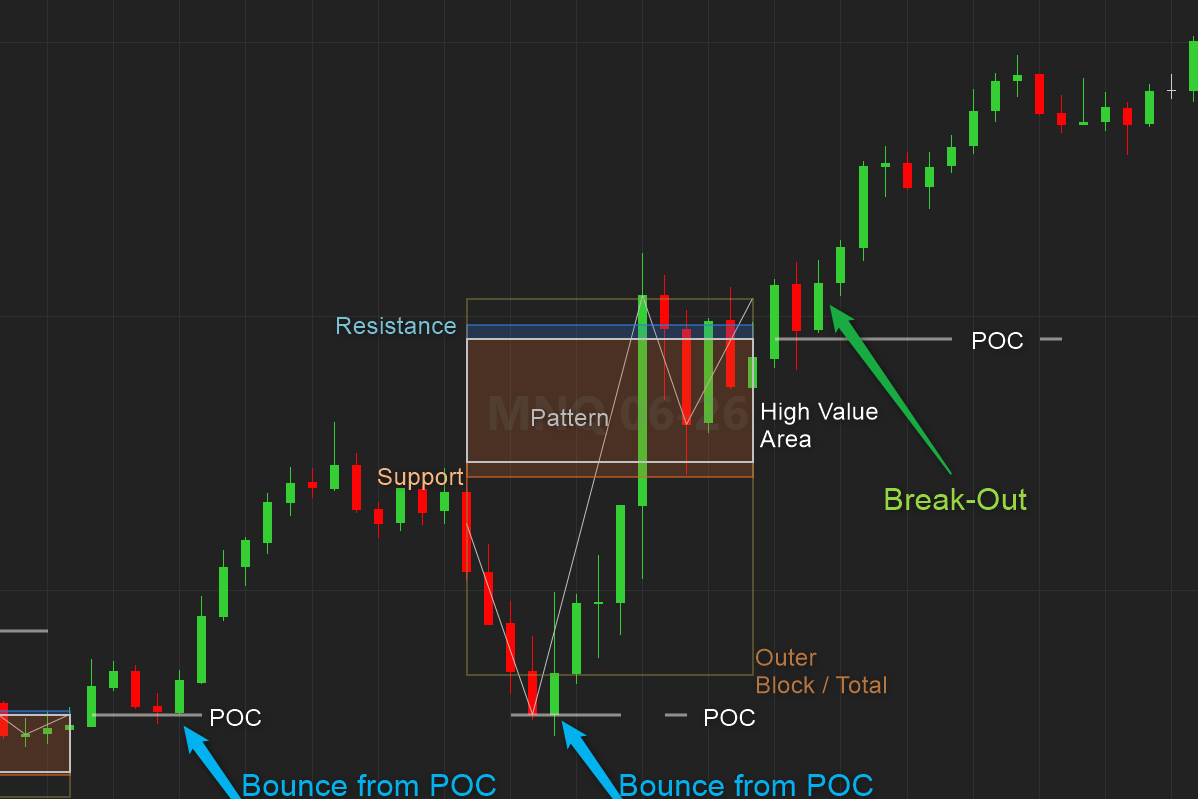
- We find the Point of Control (POC) This is the most significant level in the consolidation. We will be looking for breaks away from this level for breakouts and pullbacks towards this level for reversal set-ups. This is by far the most significant level ,
- We find the strongest and closet resistance and support levels above and below the POC. Much like we would define High Value nodes in a volume profile. These make up our Orange and Blue blocks (Rectangles)
- Then we define the outer range of the consolidation that is statistically relevant. This is the White Block
- Next we define the entire area under review with the Light Yellow Block.
- We also plot the Price Action Pattern inside the Block
Profit Targets and Support / Resistance – Define the scope of the Trade
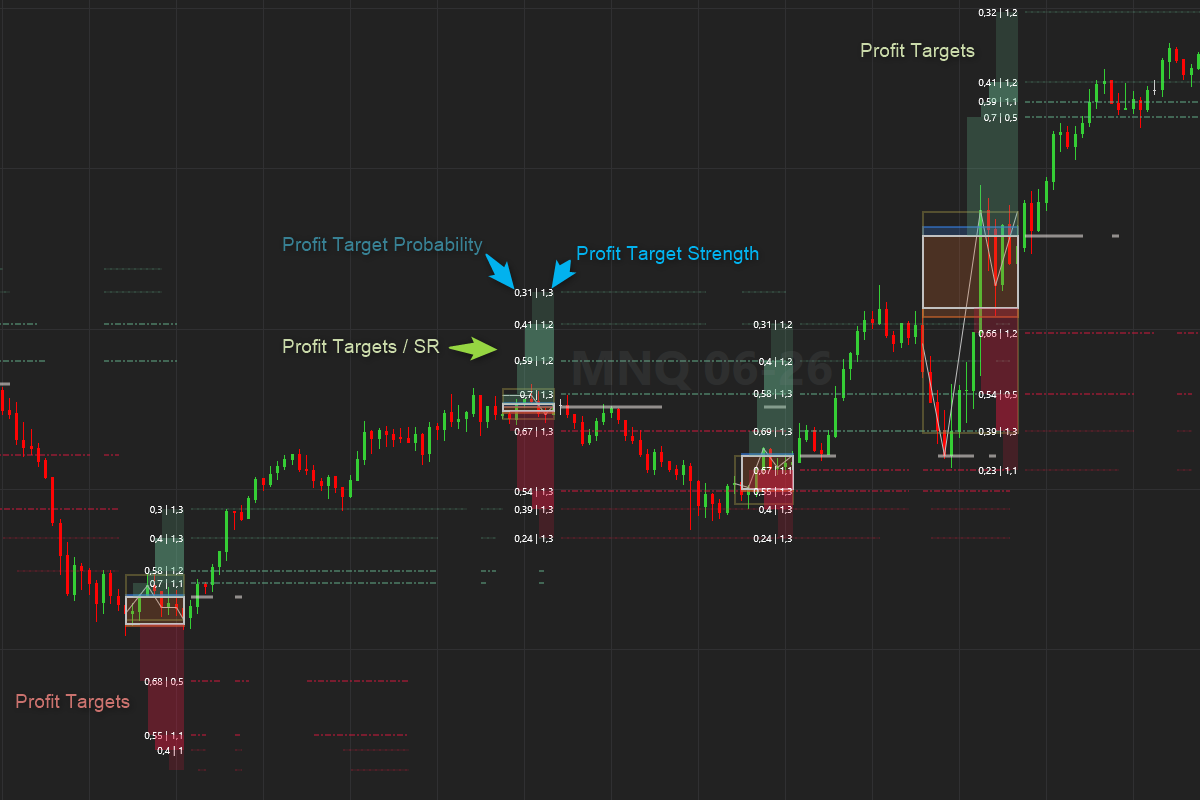
- We need to know where to place our Profit Targets. Basing it on a simple 1, 2, 3 ATR just doesnt cut it. Its far better to base it on significant support and resistance levels
- Knowing the probability of reaching any of these levels are also invaluable. As an example if the price has moved to the 4 th resistance level form the breakout and the level has a probability of 0.26 then we know we only have a 26 % chance of the price moving higher and it might be best to have exited most of your position at this level. Also when level 1 has a probability of 0.67 then we know that we have a 67% chance of reaching this level. It might be close but it has a very good chance to make for a profitable scalp trade
Our SR levels (Profit Targets) are defined by POC levels, Pivots , LVNs , HVNs and more. Levels are added if they are significant enough and removed when the are no longer relevant or negated. They are also further refined to find the POC in every bar instead of simply the Close or High/ Low or Pivot High/Low . This make for really accurate levels which is absolutely essential for profitability
Patterns
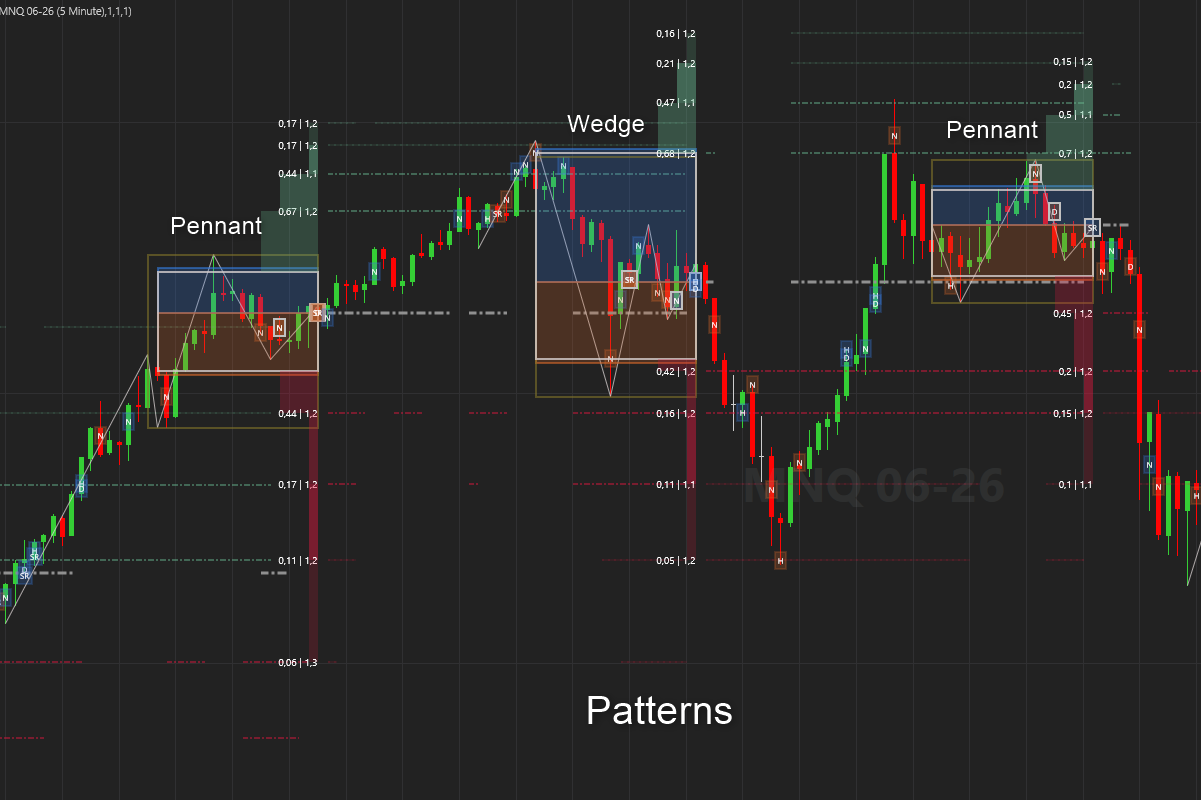
This indicator doesn’t simply look at pivot highs and lows , or equal highs and lows to define the consolidation block but it rather finds the patterns that lead to the consolidation, These patterns are defined by price action , accumulation and distribution of volume (heat), past support and resistance levels and momentum metrics.
These consolidations can show up as Wedges, Flags , Pennants ,Ranges or Trend Channels etc. As these patterns often lead to major moves the goal is to define these patterns timeously and accurately and profit from the moves that follow from them.
TrendLines
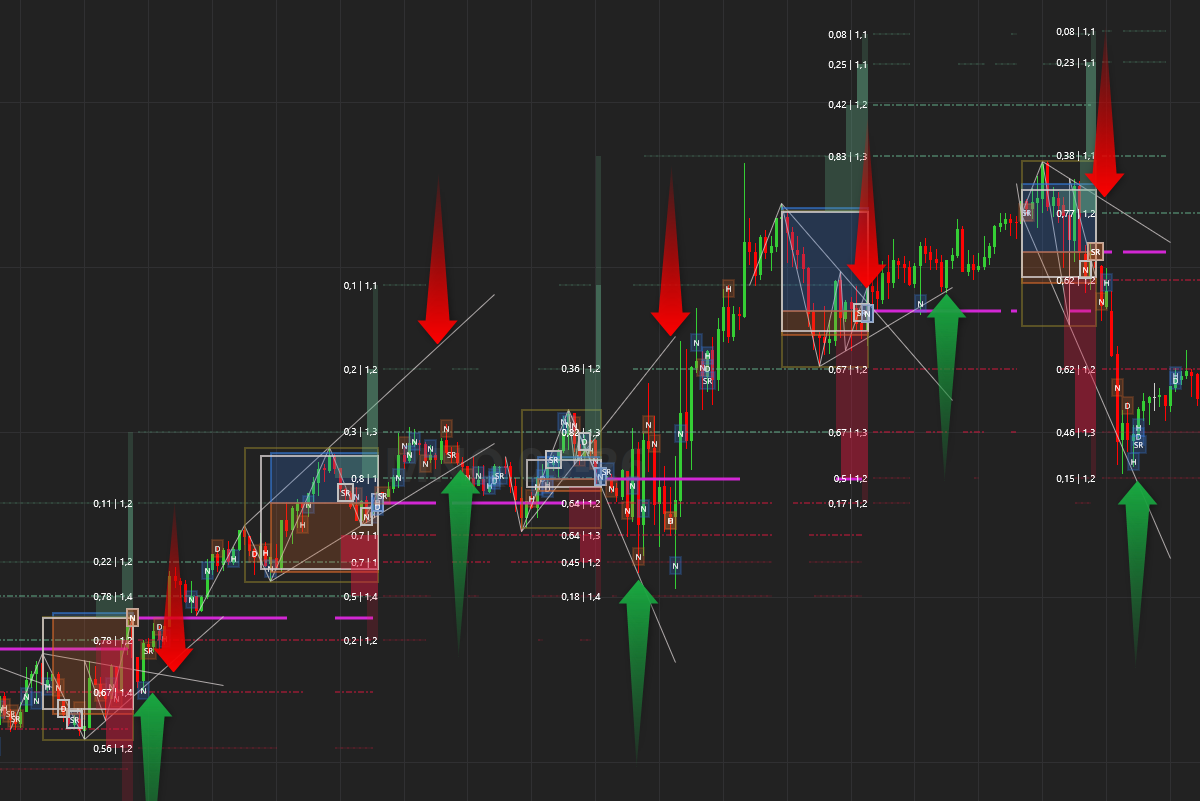
These trendlines are very helpful with defining entry levels as well as projecting where the price might go after the consolidation. They also offer good support and resistance levels in a trend which are great for pullback trades. Price levels where support and resistance levels intersect with trendlines creates very significant levels to trade from.
Cumulative Delta – Who is in control, buyers or sellers ?
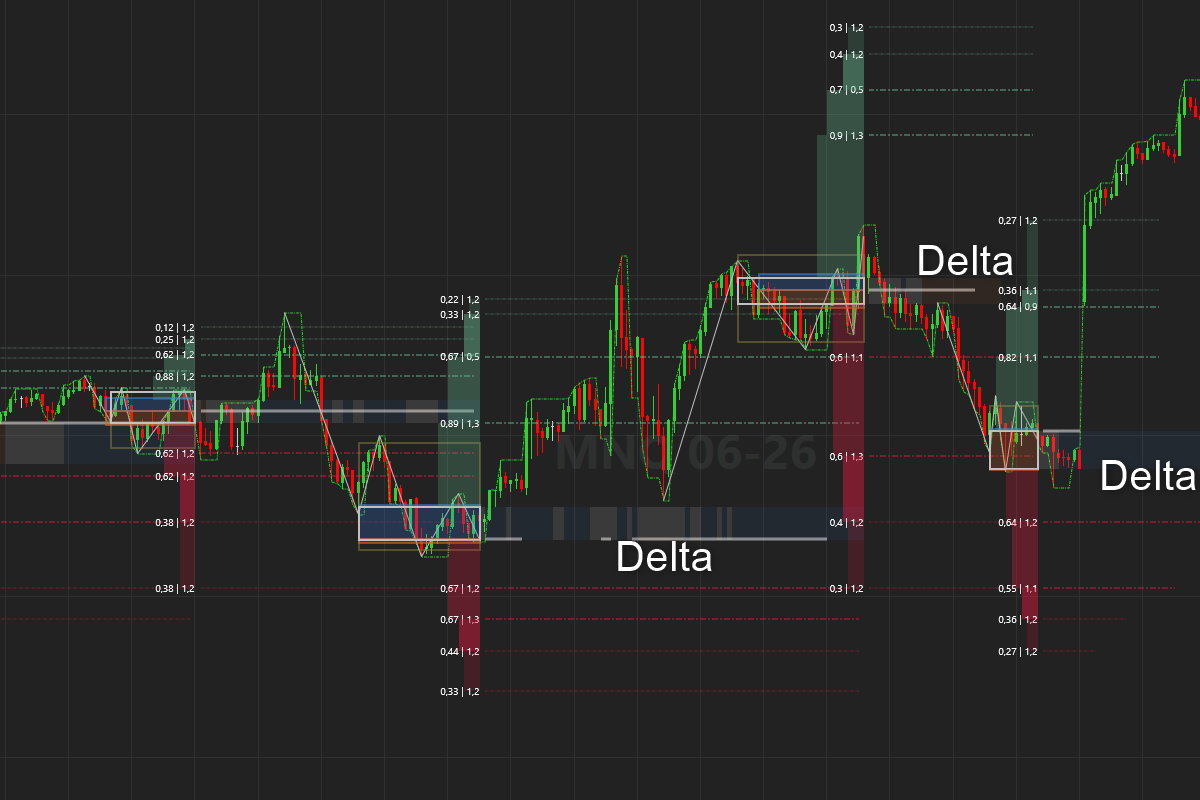
We calculate the cumulative delta from when a new consolidation is confirmed. This helps to determine if the buyers or sellers are in control. Delta flips makes for good trade setups as it shows the shift in buyer vs seller behavior
Anchored VWAP
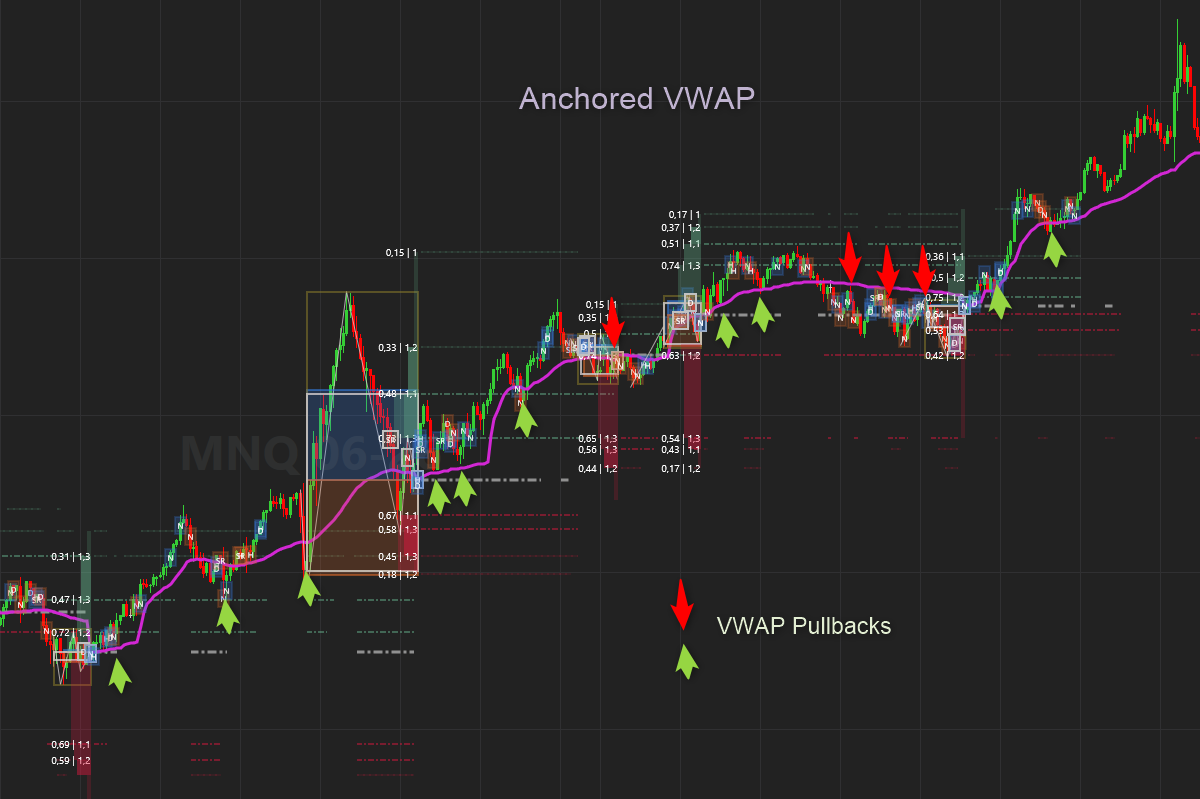
This indicator anchors the VWAP when a new consolidation is formed. This is an ideal time to anchor a VWAP as the consolation should precede a new trend with the VWAP defining the new trend. Its really helpful to use as a trialing stoploss or trade pullbacks from the VWAP level in the trend direction
Heat
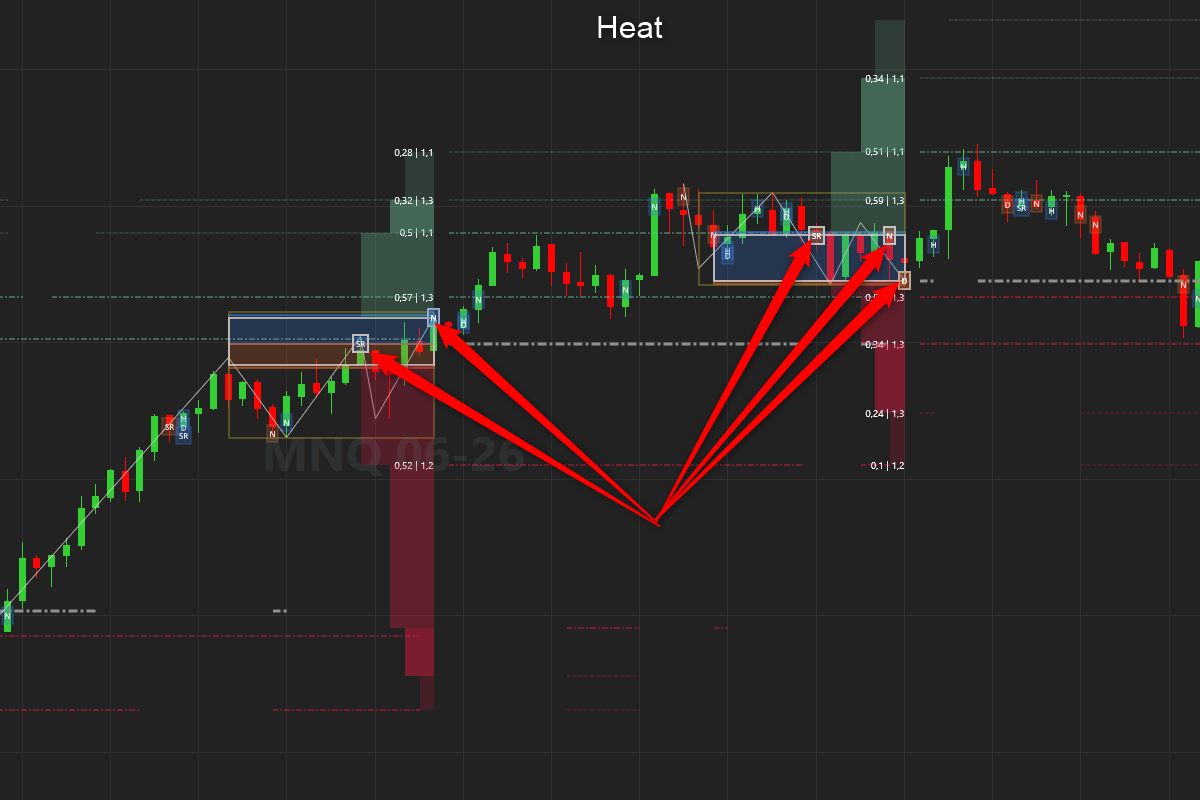
We have included some of the features of our Q-Bars / Heat Bars indicators in this indicator.. The patterns , VWAP, Cum Delta etc. shows us the context or the larger picture. The Heat shows us the micro or intrabar information that we need to
Settings