Heat
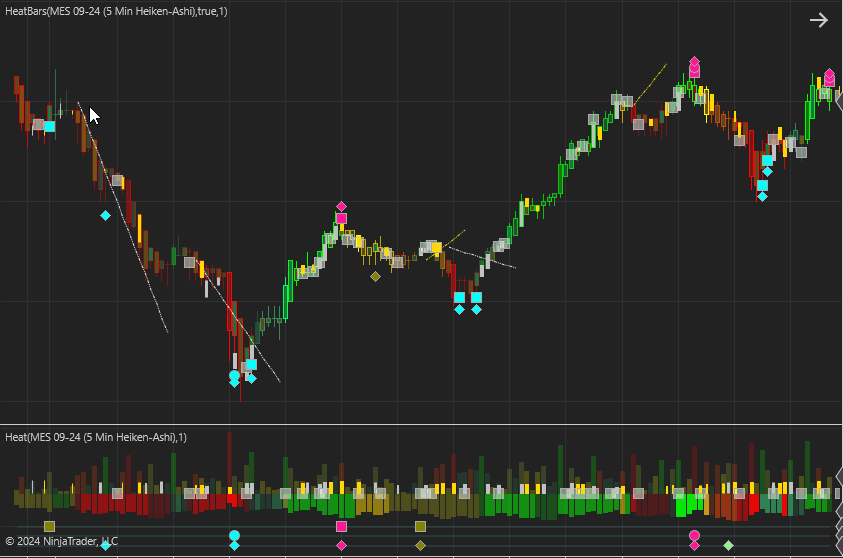
Most of us use a bunch of indicators to tell us the states of the trend, momentum, volume, volatility and other variables. It can become quite daunting to figure out just what is really going on in the market. We can get many confusing signals by using all our indicators.
We have created a model that combines a whole bunch of our best indicators in to One indicator. This model assigns a weighted value to all the readings that we get from the pool of indicators. We then simply assign a color based on these values and plot it as bars in an Heat indicator (Oscillator) and color the price bars with the Heat Bar indicator. The goal is to let the colors show us the way. This helps us consciously and subconsciously to get a “feel” for the market.
The color changes are dependent on trend , momentum and volatility metrics and the brightness of the colors change with the volume metrics.
We have created 2 indicators for the Ninjatrader platform to help with this. The Heat indicator is an oscillator that can be plotted above or below your price chart and the Heat Bars indicator will change the bar colors of the price chart..
Color Scheme
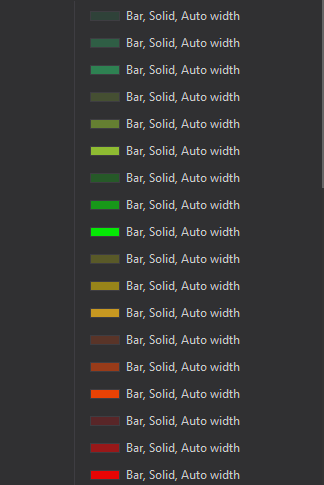
We use a basic color scheme that changes from Yellow, to Orange and then Red for the negative values. Sea Green (dull green) to Yellow Green and finally Lime for the positive values. These colors are all customisable.
Heat Current Bar
The bars plotted above the 0 line shows the “heat” experienced in every bar.
The brightness (opacity) changes with Volume metrics. The Brighter , the stronger
Heat Trend
The bars plotted below the 0 line shows the current trend and changes in the trend. Red would indicate a strong downtrend and Yellow a weak downtrend.
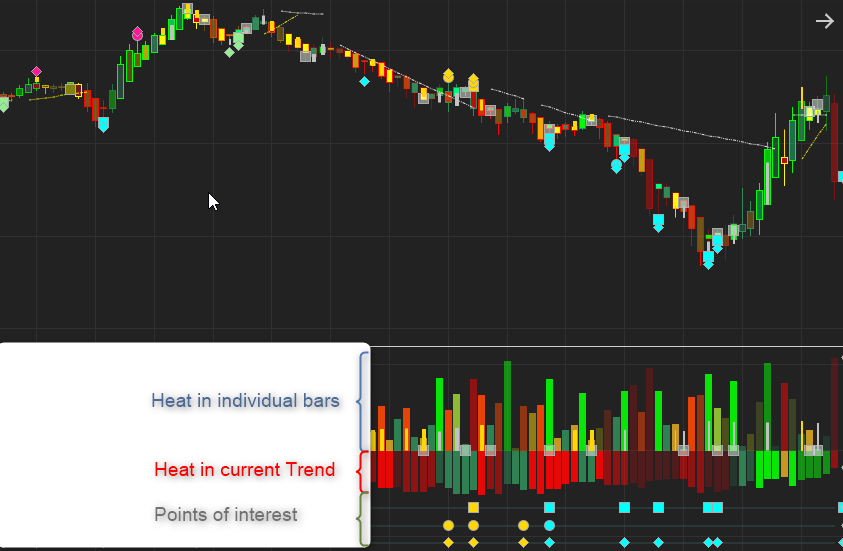
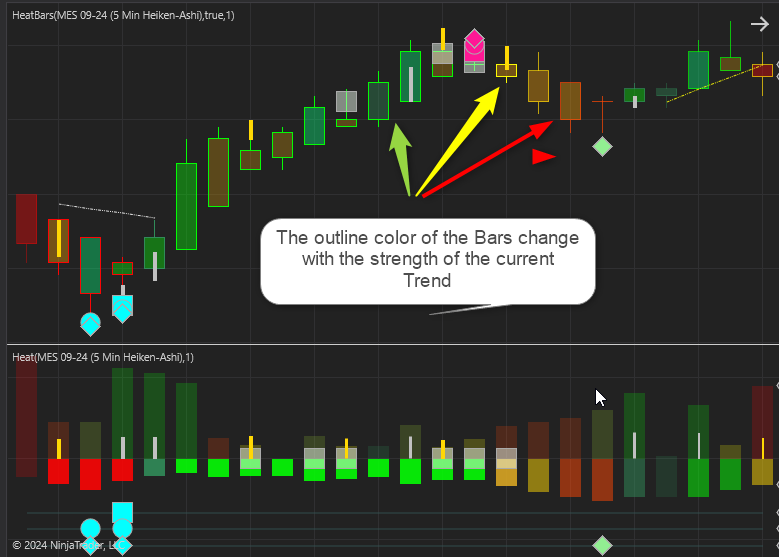
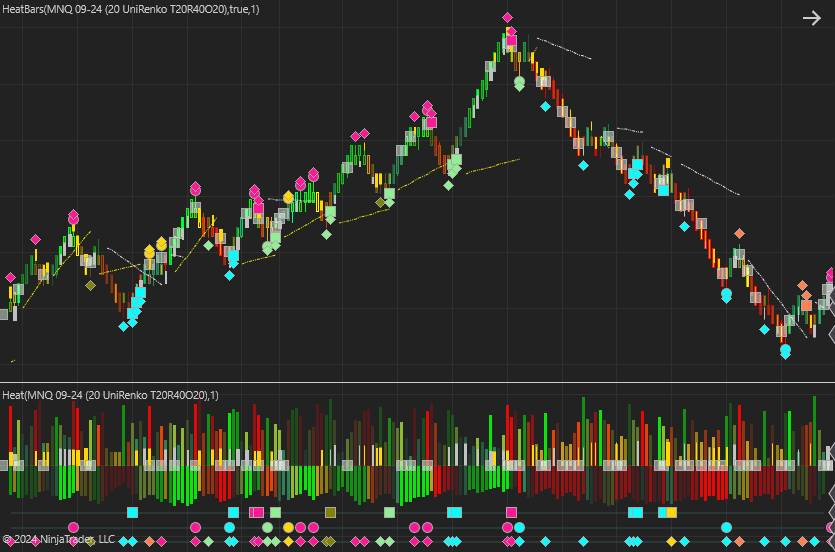
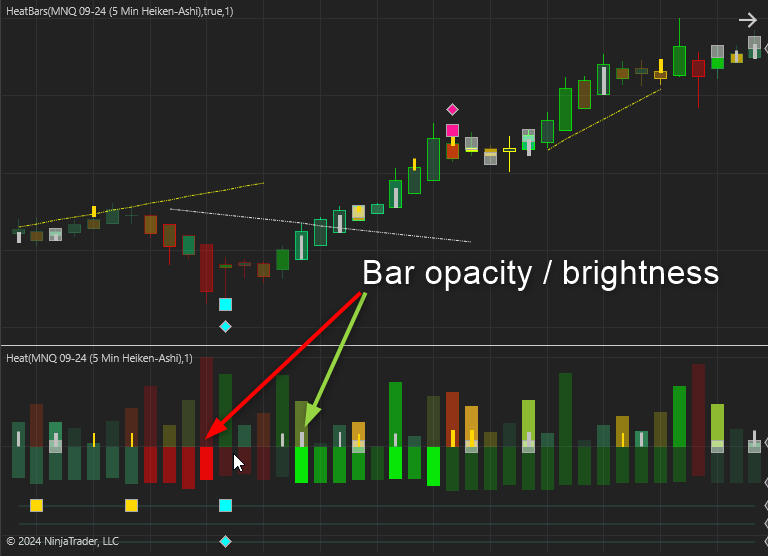
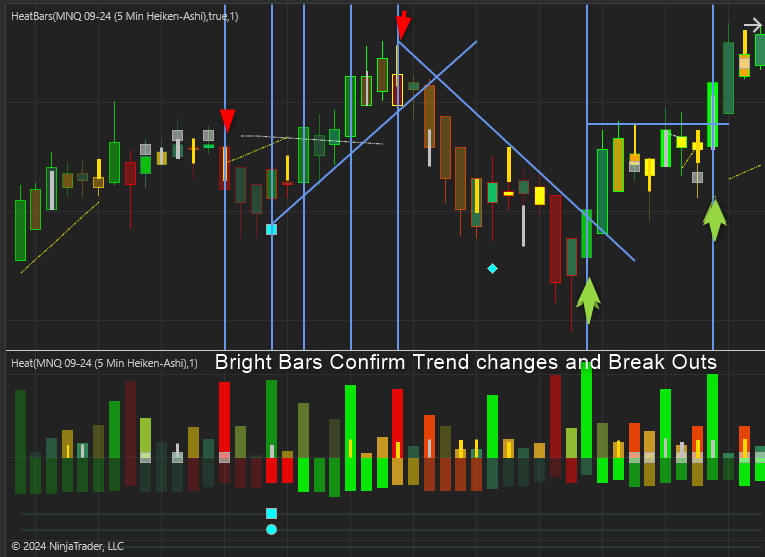
The brightness of the bars change with the amount of heat in the current trend compared to previous trends. Very bright colors at the start of a new trend signifies strength, but also bright colors in an old trend shows weakness ahead.
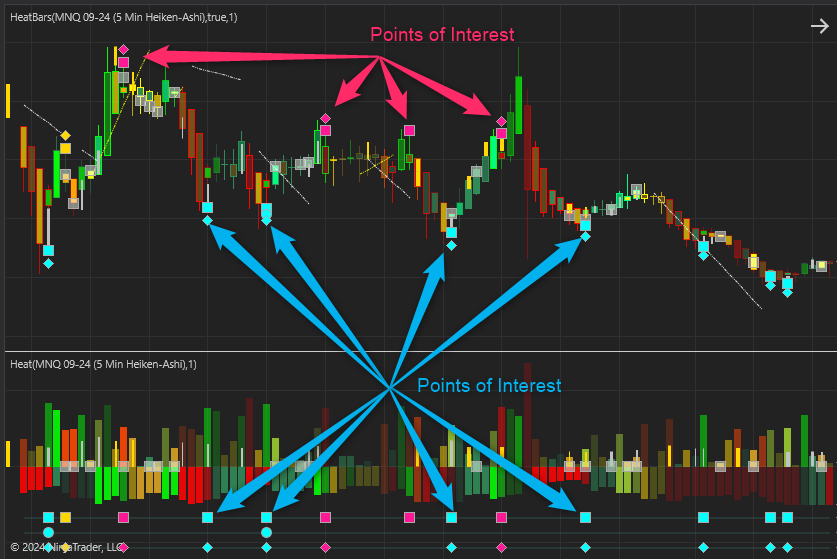
Points of Interest
We compare various variables from the current trend with previous trends to show us areas where the trend could potentially change, or pause. We denote them with Diamonds , Squares and Dots. These POI`s are extremely helpful with reversal trades and exits.
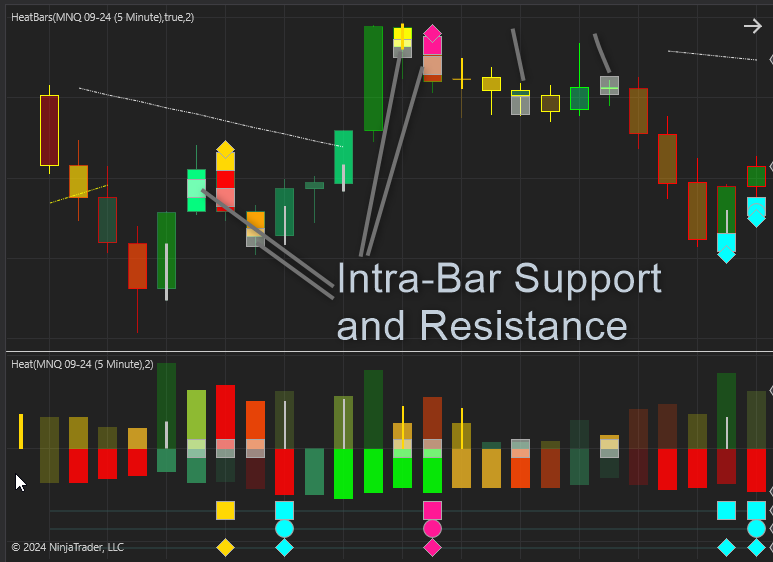
Intra Bar Support and Resistance
When a significant Volume resistance or support is created intra bar, the indicators plots a Silver colored Square at the SR level. These levels are very helpful as the market often turns or consolidate at the levels
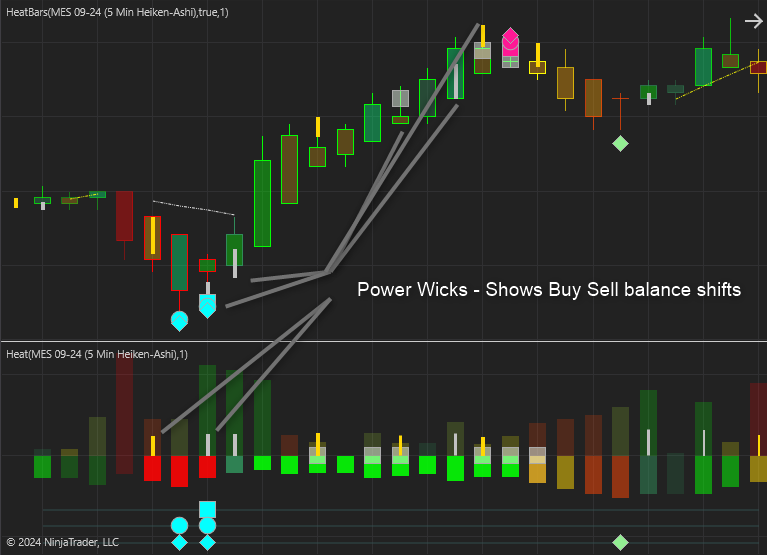
Buy / Sell Imbalances – Power Wicks
The indicator measures the balance between the buying and selling “heat” intra bar. When it finds a significant imbalance It colors the wick, It draws the wick from the High or Low to the intra bar SR level. Trend changes often occur after a significant shift in buying / selling “heat”.
Trends
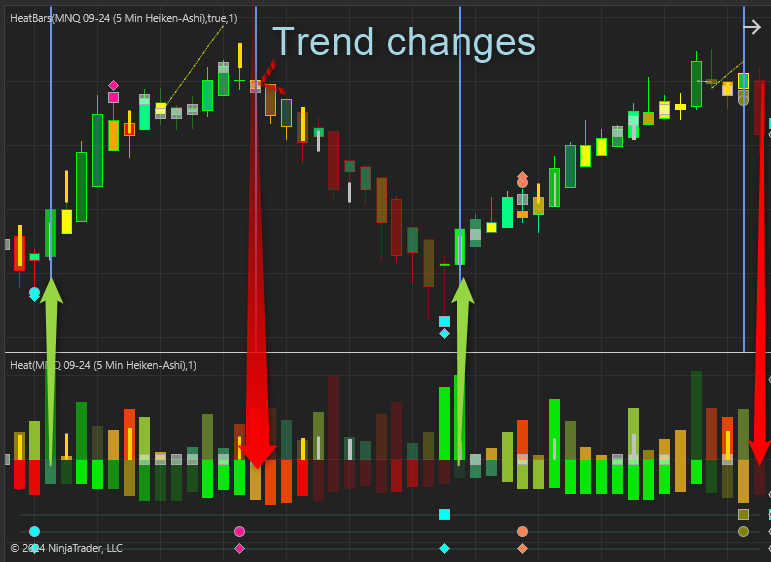
Since we are measuring the heat far more effectively we are able to detect trend changes much faster and with far less whipsaw.
With the Heat bars indicator we color the the outline of the bars and with the Heat (oscillator) indicator we plot bars below the 0 line to indicate the trends.
We use 3 trends to change the colors of the indicator. Fast , medium and slow. The brightness of the colors change with the heat in the current trend compared to previous trends.
TrendLines
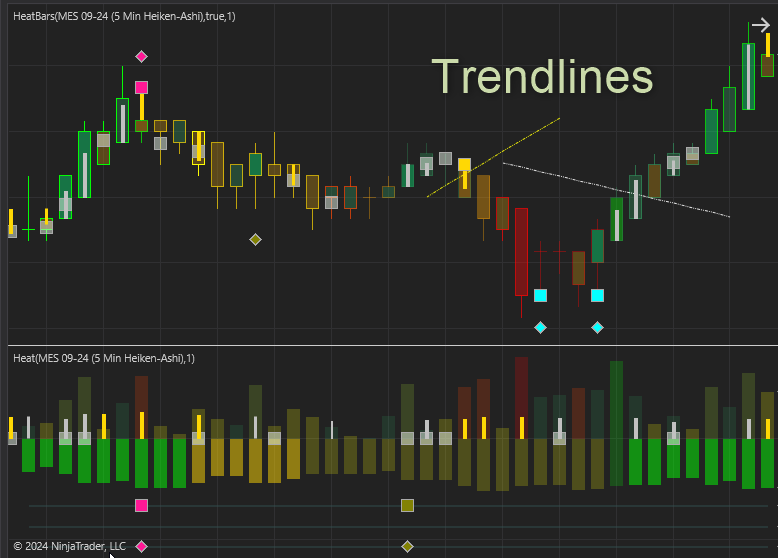
We have added some trendlines to the indicator to help some more. Only available with the Heat Bars indie.
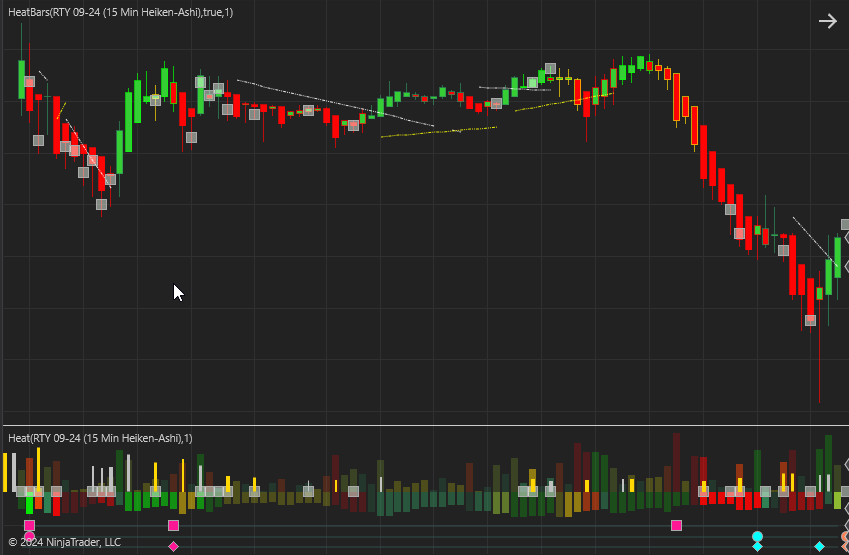

- Works on All Bar Types, instruments and timeframes
has been added to your cart!
have been added to your cart!