HeatBars

Most of us use a bunch of indicators to tell us the states of the trend, momentum, volume, volatility and other variables. It can become quite daunting to figure out just what is really going on in the market. We can get many confusing signals by using all our indicators.
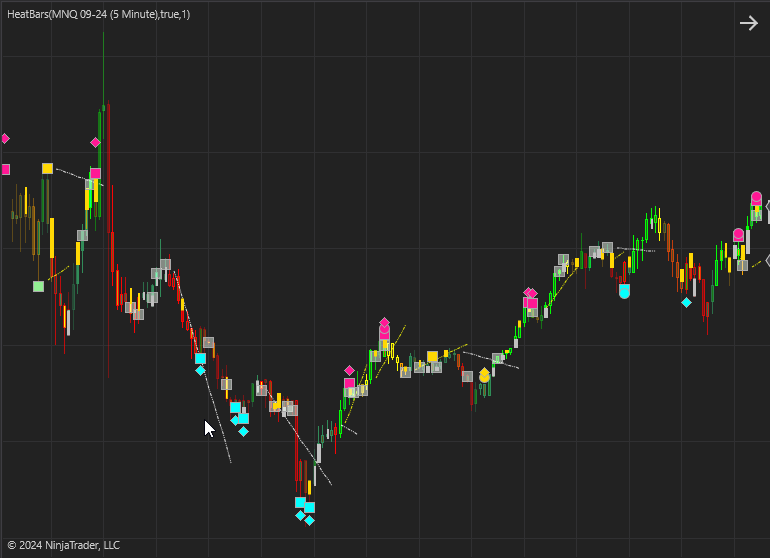
We have created a model that combines a whole bunch of our best indicators in to One indicator. This model assigns a weighted value to all the readings that we get from the pool of indicators. We then simply assign a color based on these values and plot it as bars in an Heat indicator (Oscillator) and color the price bars with the Heat Bar indicator. The goal is to let the colors show us the way. This helps us consciously and subconsciously to get a “feel” for the market.
The color changes are dependent on trend , momentum and volatility metrics and the brightness of the colors change with the volume metrics.
We have created 2 indicators for the Ninjatrader platform to help with this. The Heat indicator is an oscillator that can be plotted above or below your price chart and the Heat Bars indicator will change the bar colors of the price chart..

Color Scheme
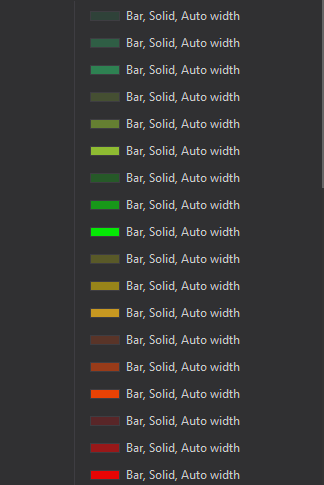
We use a basic color scheme that changes from Yellow, to Orange and then Red for the negative values. Sea Green (dull green) to Yellow Green and finally Lime for the positive values. These colors are all customisable.

Heat Current Bar
The bars plotted above the 0 line shows the “heat” experienced in every bar.
The brightness (opacity) changes with Volume metrics. The Brighter , the stronger
Heat Trend
The bars plotted below the 0 line shows the current trend and changes in the trend. Red would indicate a strong downtrend and Yellow a weak downtrend.
has been added to your cart!
have been added to your cart!