Market Structure SR
Market Structure SR: Volume Profile ,Precision Support & Resistance for Smarter Trades
With this indicator we took all of the great features of our Market Structure indicator and added Support and Resistance levels to it.
The SR levels are derived from previous Point of Controls, High Volume and Low Volume Nodes. The SR levels are also validated, filtered and removed to ensure that only the best and most tradeable levels are produced by the indicator.
We have also significantly improved the algorithms that determine the Volume Profile and SR levels which makes this indicator far more accurate than all our previous indicators.
Its really essential to see the “Big Picture” in trading, the context. This indicator excels at illuminating that
Overview
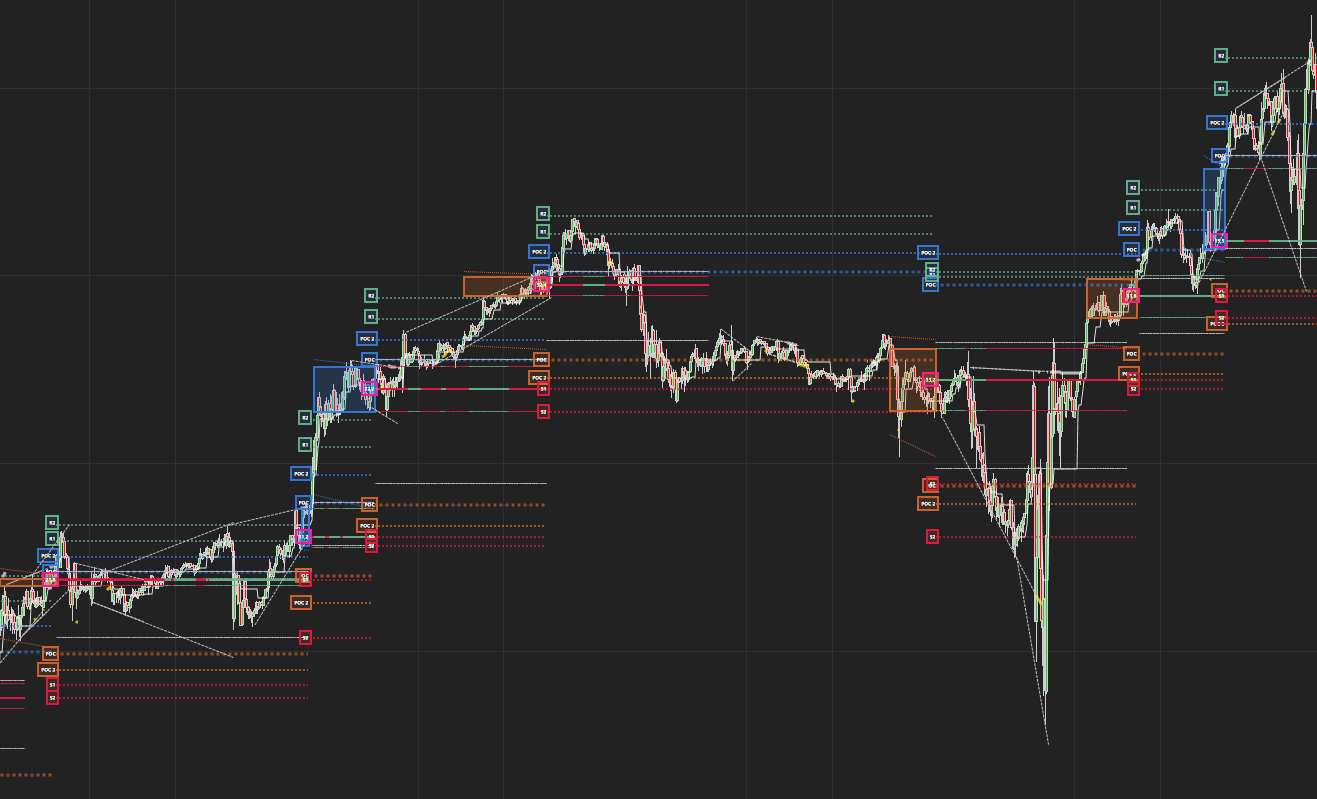
The indicator finds levels of interest with a complex algorithm that uses mainly Volume and Volume Delta to determine distributions and levels.
This Volume Profile consists of :
- The Point of control ( The strongest level in the distribution ) ,
2) High Volume Nodes . The Second and 3rd strongest levels after the POC. It finds a HVN above the POC and a HVN below the POC.
3) Low Volume Nodes . These are the levels with the Lowest interest. It finds a LVN above the POC and a LVN below the POC.
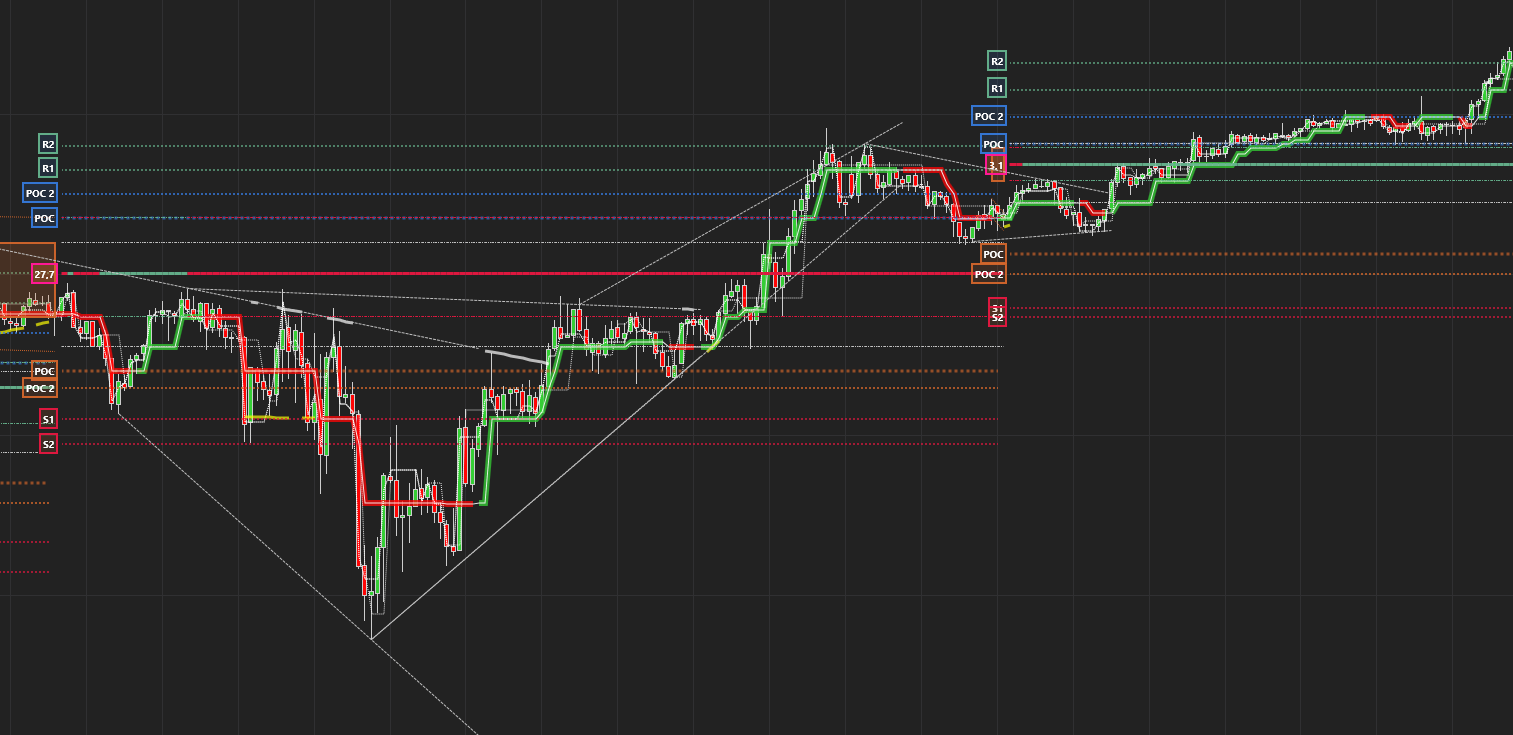
Support and Resistance Levels
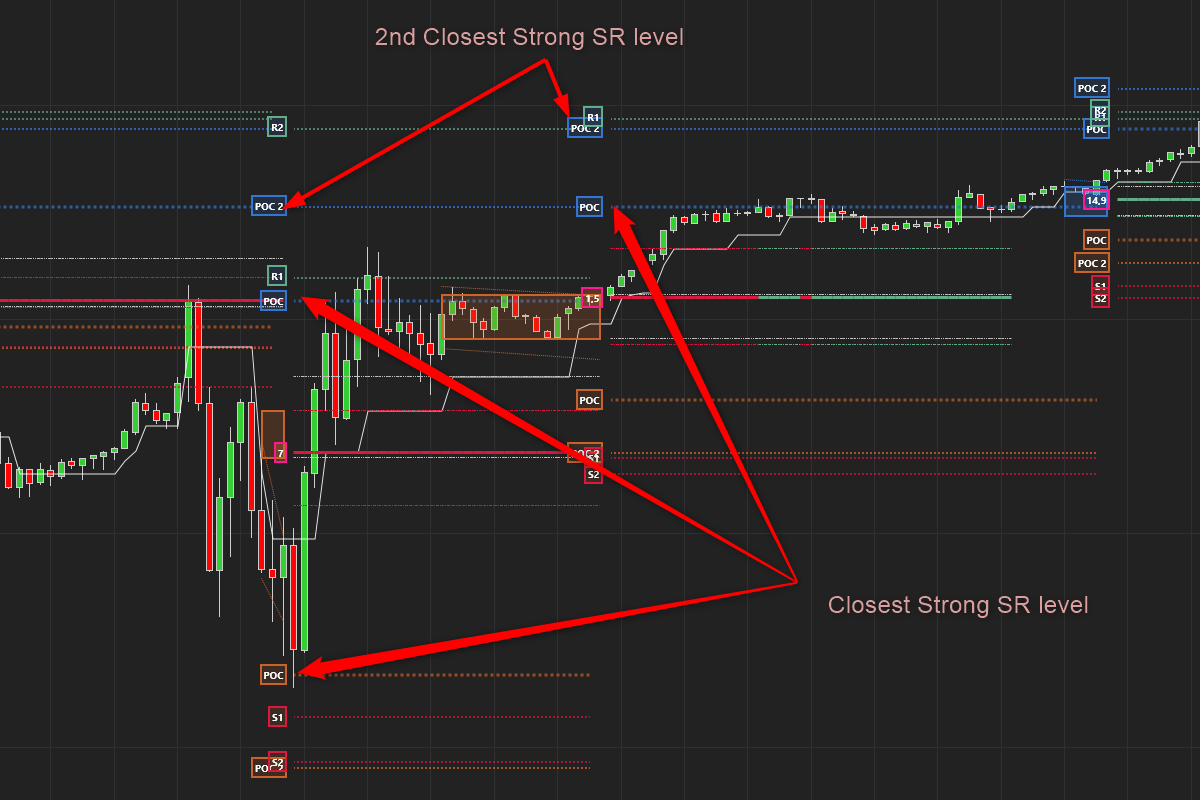
VP levels, especially the POC makes for great Support and Resistance levels. This indicator adds all these levels to a list when a new Volume Profile is created, then filters them for validity and relevance as the market develops. This ensure that only the most relevant and accurate levels are produced when a new VP spawns.
POC – This level is based on past POC levels and is the closest past relevant POC level above / below the new Volume Profile range.
POC2 – This level is based on past POC levels and is the 2nd closest past relevant POC level above / below the new Volume Profile range.
R1, R2, S1 and S2 are levels based on past High Volume and Low Volume Nodes that are still in play.
What do you do with all this VP information, all these levels?
Detect the Smart Money Flow
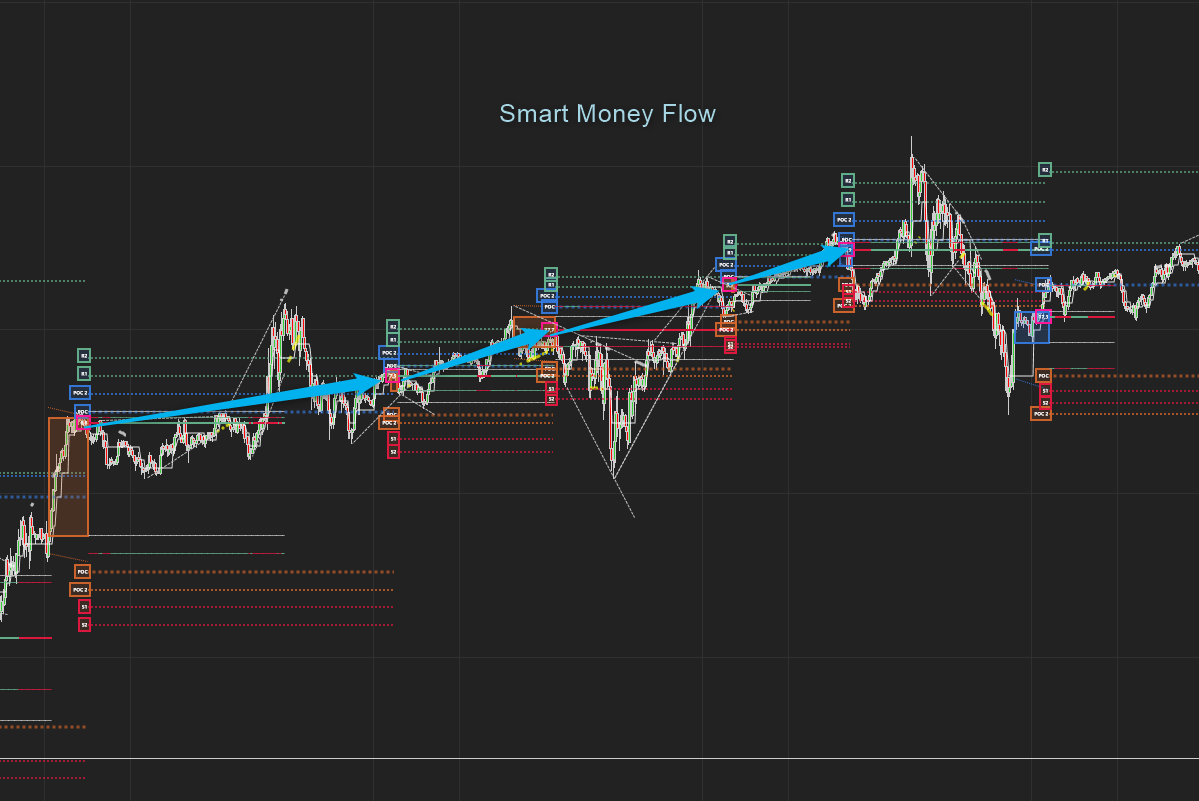
Connecting the POCs of every Volume Profile distribution gives as a clear indication of the trend direction and dynamics and also how the Money flows in each trend
Accumulation and Distribution
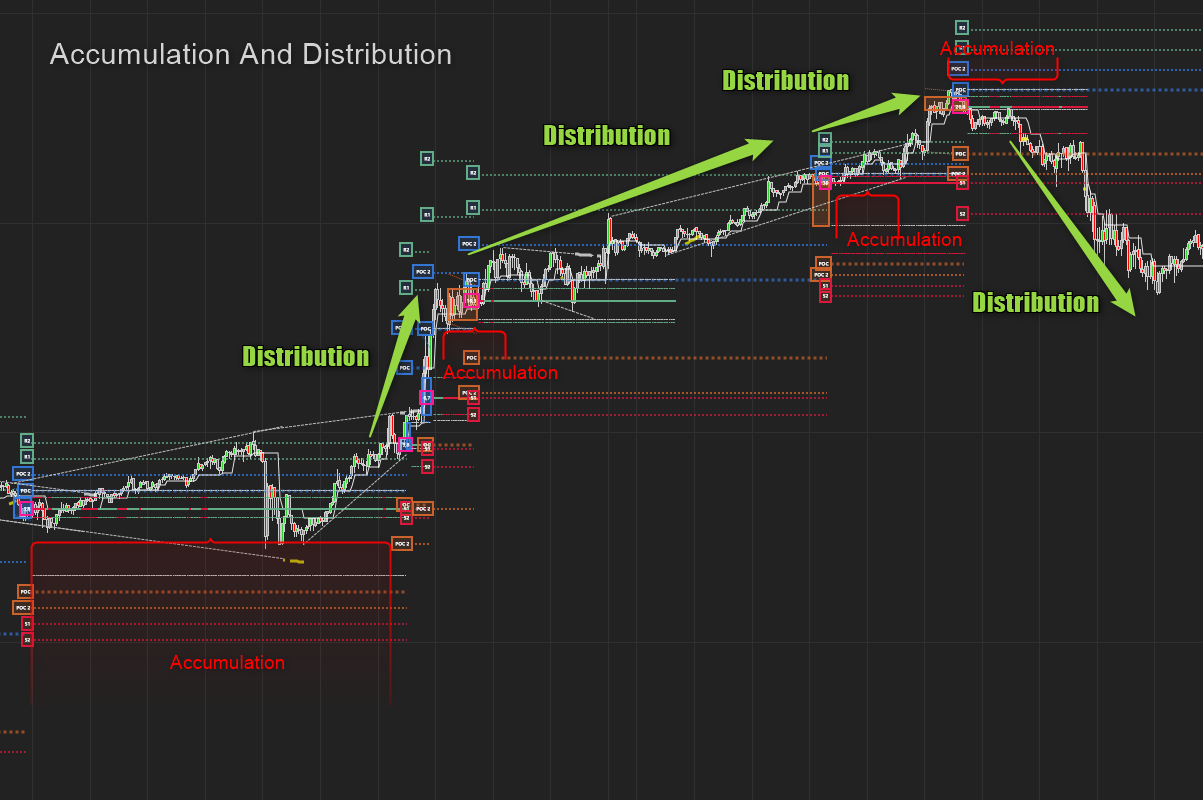
Find Great Exits
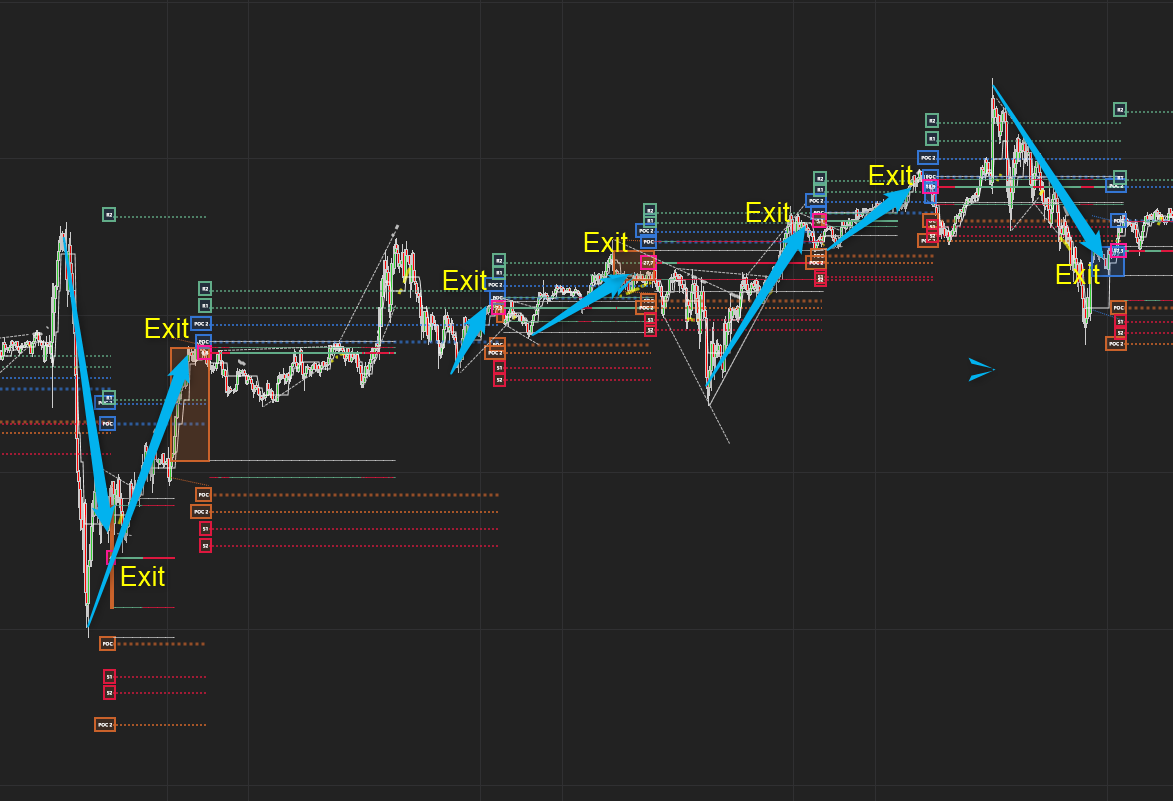
Since a new Volume Profile forms when the market starts accumulating and resistance or support forms anew Volume Profile makes for great exit signals and levels to exit around
Trade Break-Outs
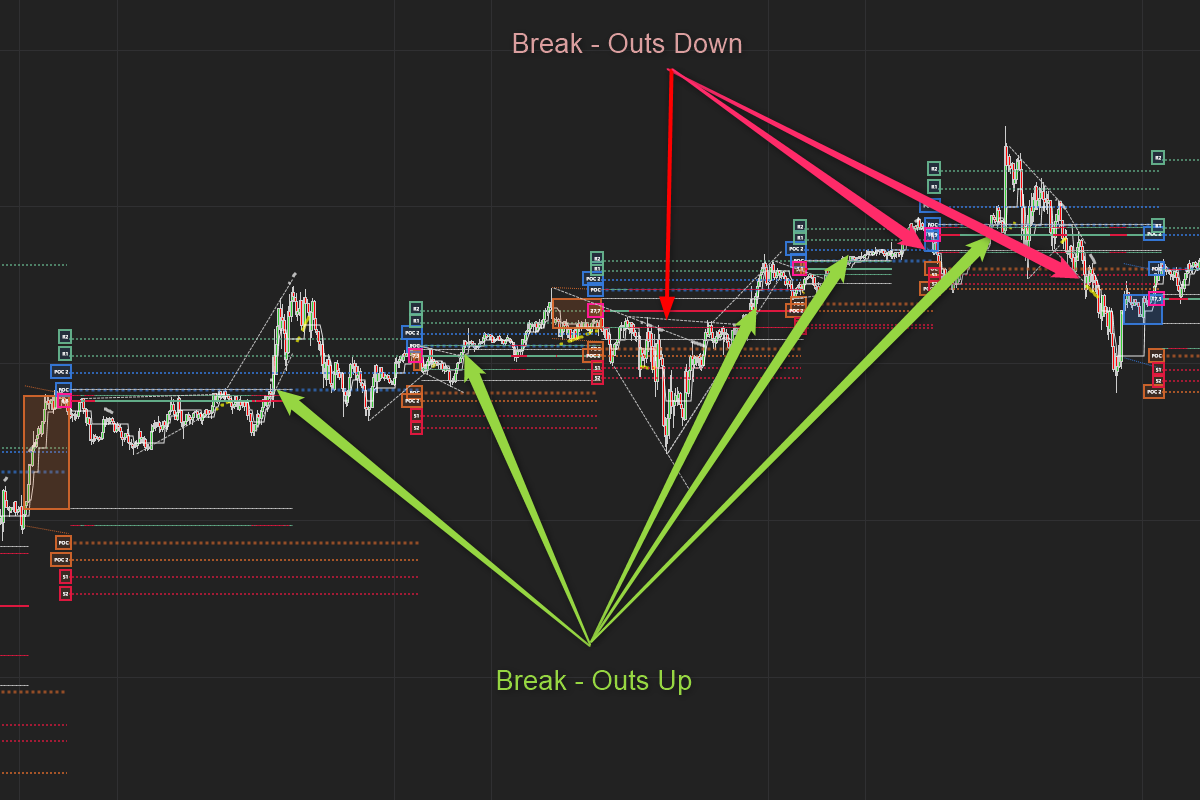
Since these Volume Profiles level shows accumulation and the accurate range of the accumulation, break-outs are far larger and less prone to be fake break-outs. The volume that accumulates in a volume profile fuels the break-out, the longer the price consolidates inside the VP the more powerful the break -outs tend to be.
Trade bounces / Reversals from Key levels
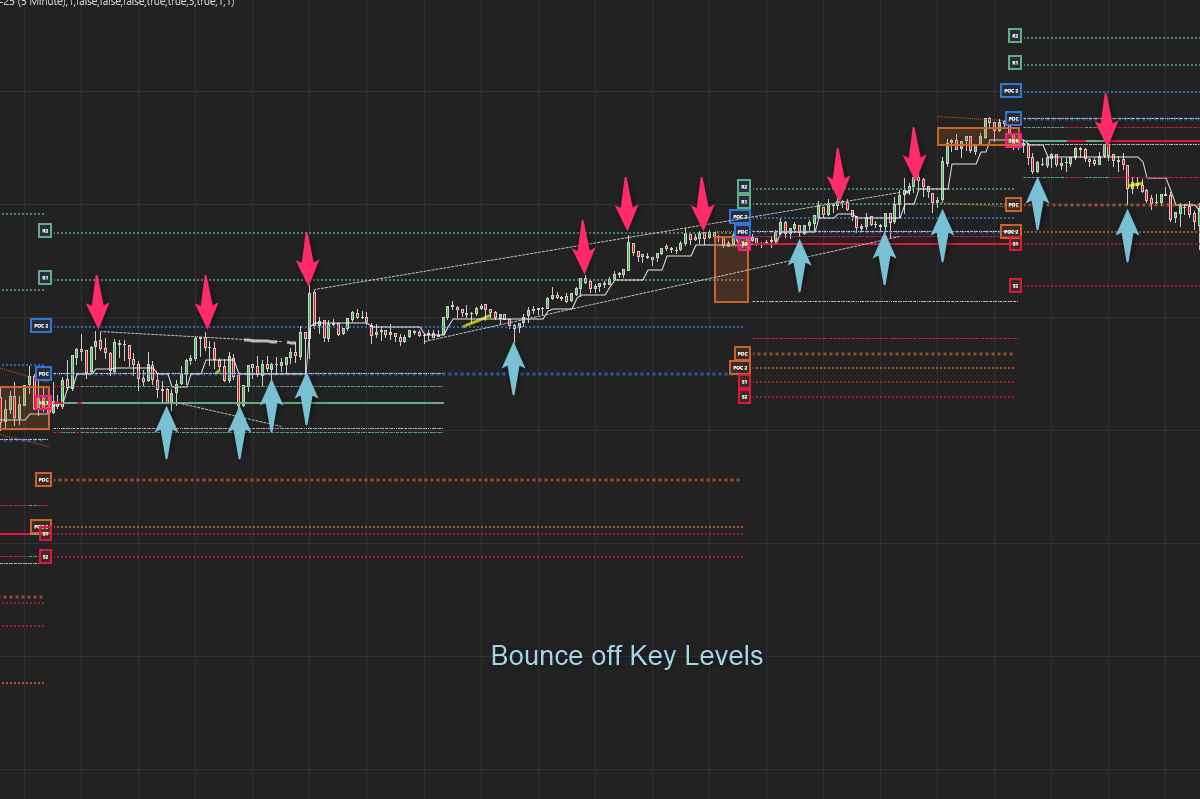
The levels determined by this indicator are filtered and screened to provide the best levels. These levels have memory of past buyers and past sellers. The Point of Control levels are generally the strongest levels and act like magnets. The price likes to revert back to these levels.
Determine the best Profit Target Levels
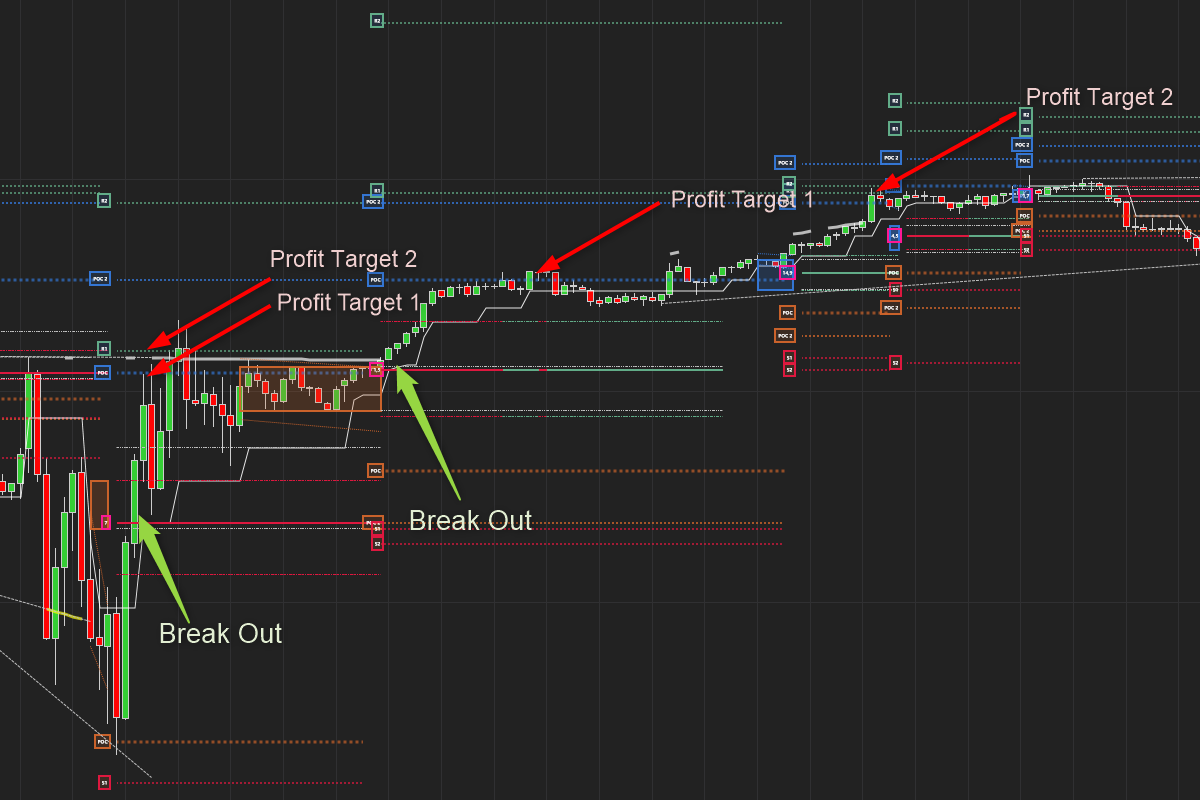
The Support and Resistance levels which are based of Previous VPs make for good profit target levels as these levels will bring resistance or support as the price nears it and that may change the direction of the move. Secondly, these levels act like magnets pulling the price towards them.
Trailing Support and Resistance + Trend
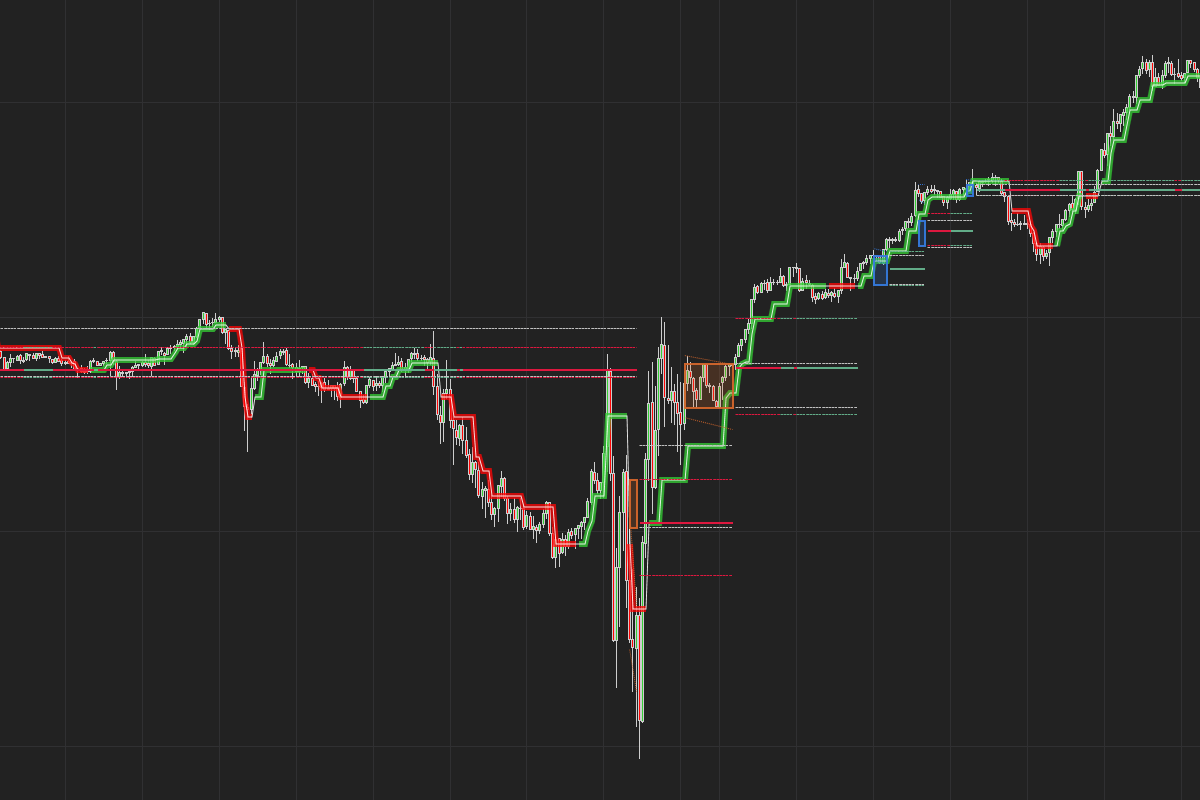
The Trailing SR plot simply uses all the past and current valid SR levels to trail below and above the current price. Its great to use as a trialing stoploss or even as a trend change detector
Trends and TrendLines
Cumulative Delta
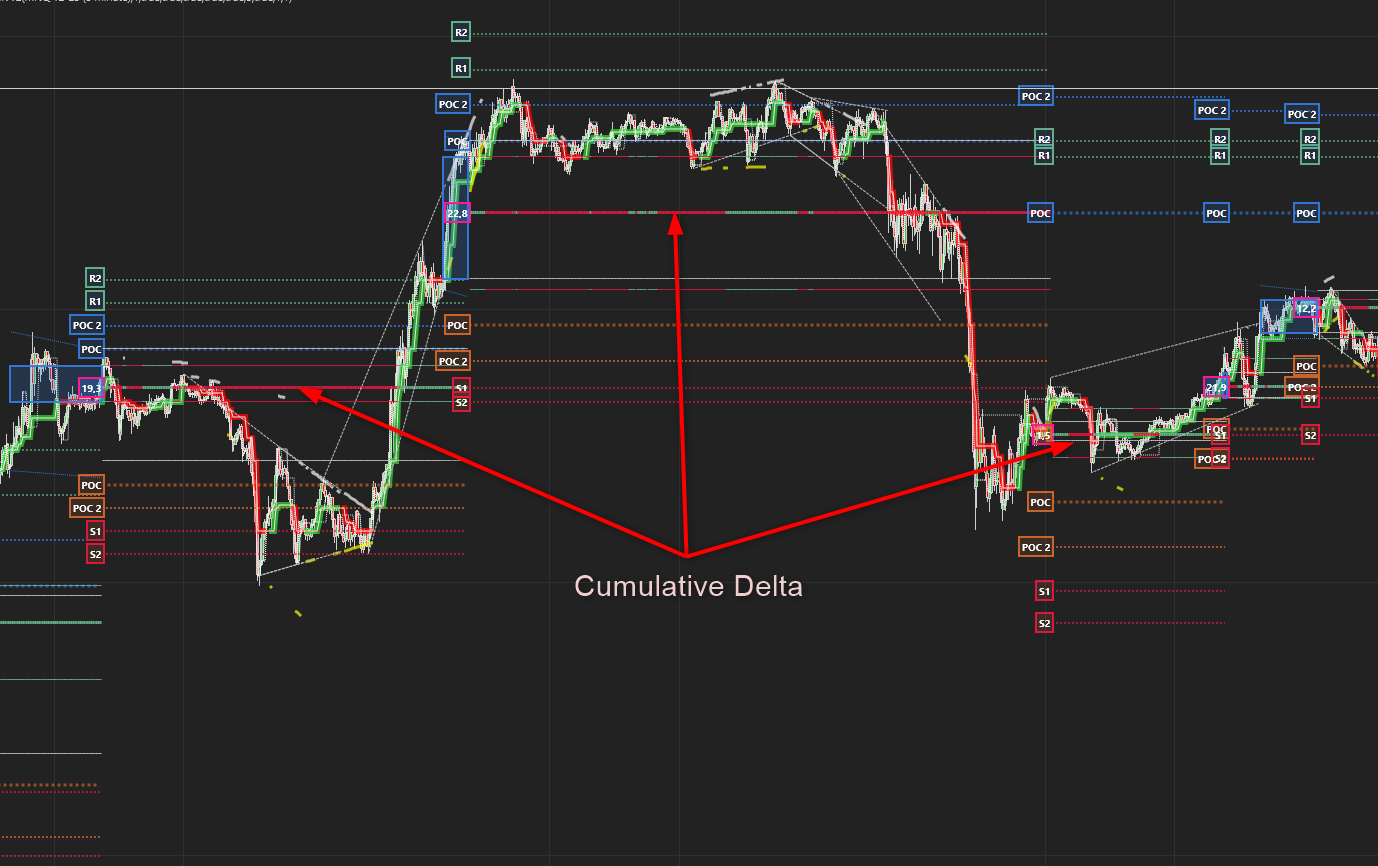
This indicator also calculates the Cumulative Volume delta for every Volume Profile. It shows the net buying versus selling pressure whilst the price is still in range. It resets when a new Volume Profile is created.
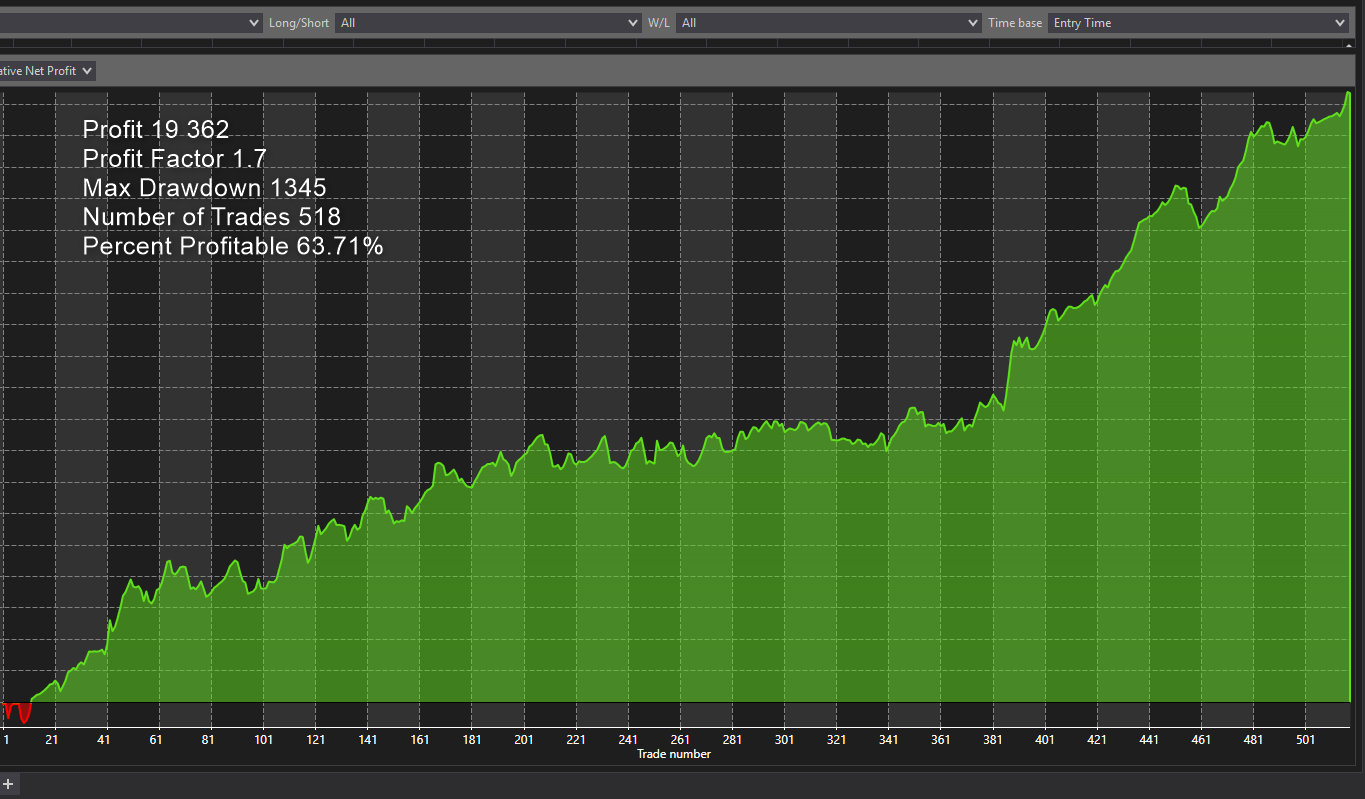
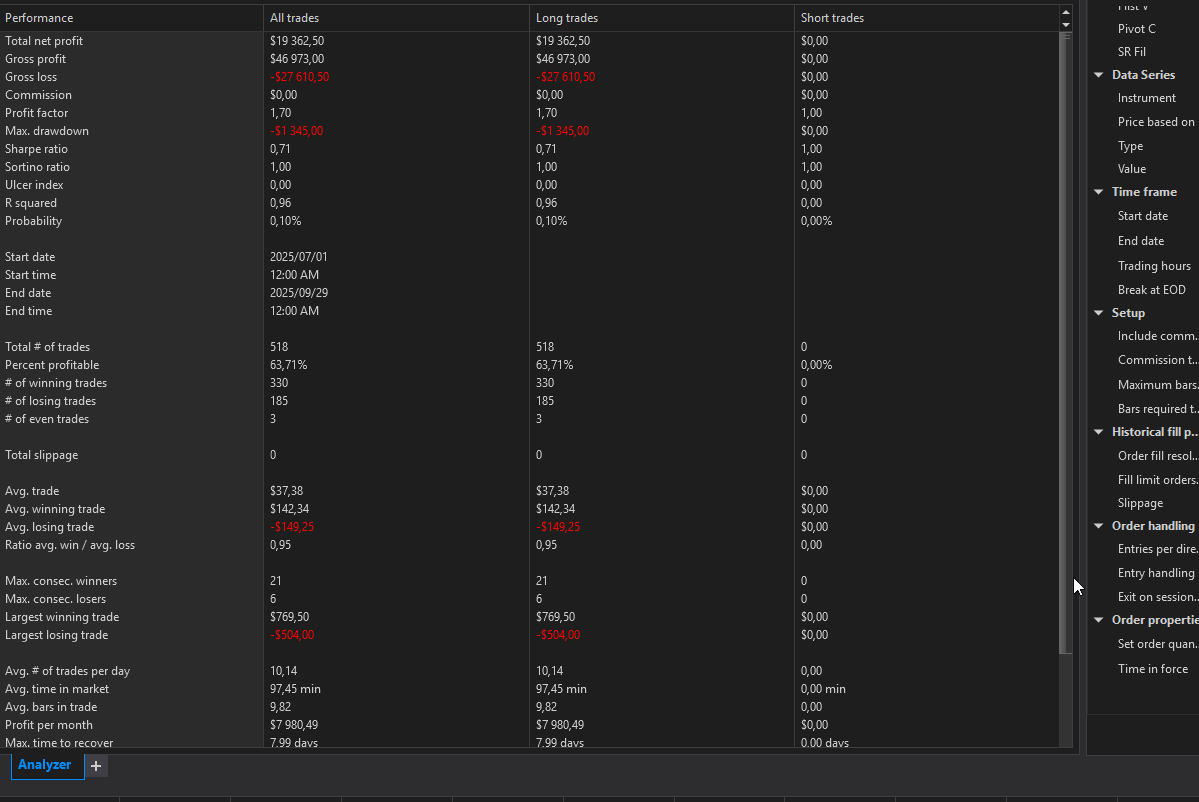
Does it work?
We have started developing a strategy based on this indicator. The strategy simply trades pullbacks to and breaks through SR and VP levels. The levels above our entry price is used for profit targets and the levels below for a trialing stoploss. Simple.
We still need to filter trades and research this more but it certainly seems to have an edge.
See our preliminary findings below
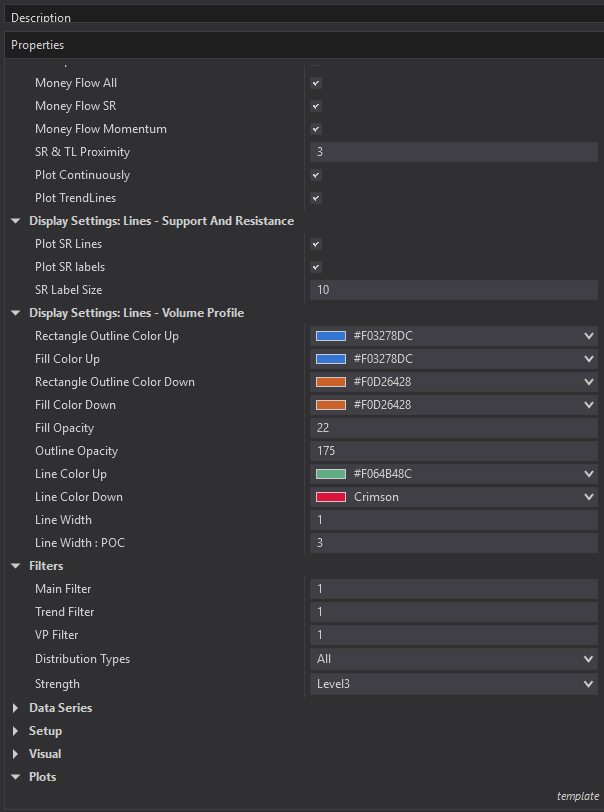
Settings
All Colors are customizable
Works on All timeframes
Works on All instruments
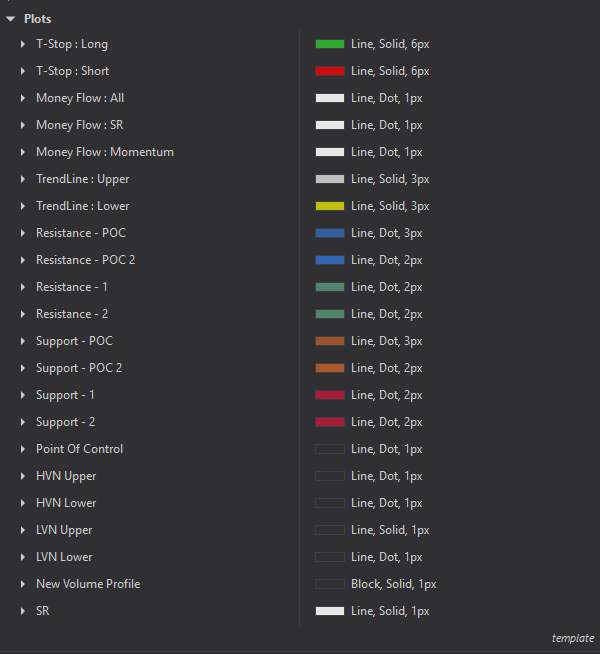
Plots can be used in the strategy builder to develop your own strategies
Drawing Objects can be used to develop your own strategies
Ready to enhance your trading strategy? Download Market Structure SR now and start seeing the bigger picture.
has been added to your cart!
have been added to your cart!