Power Signals
This indicator looks at the flow of interest in the market in terms of volume ,volatility and volume delta.
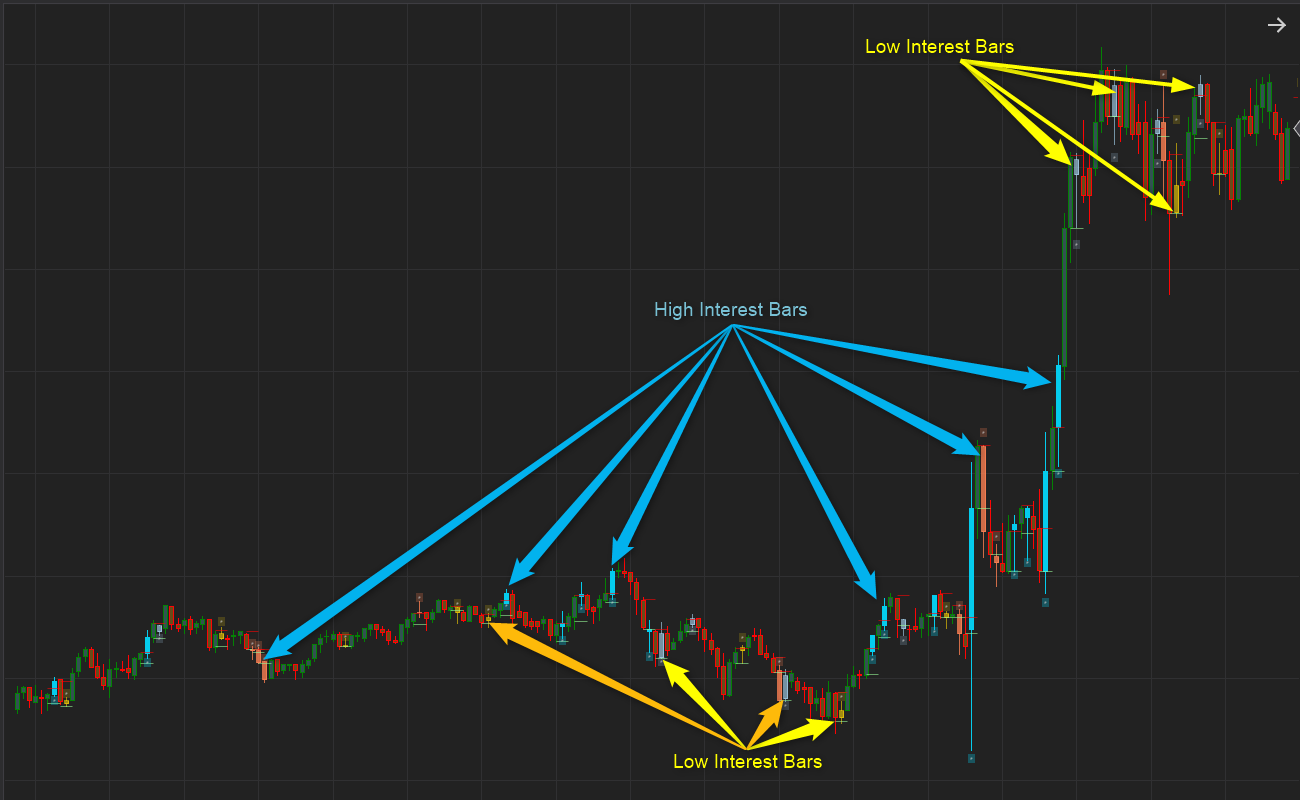
The market generally moves between areas of high and low interest. We identify and color these bars according to High – interest and Low – interest metrics.
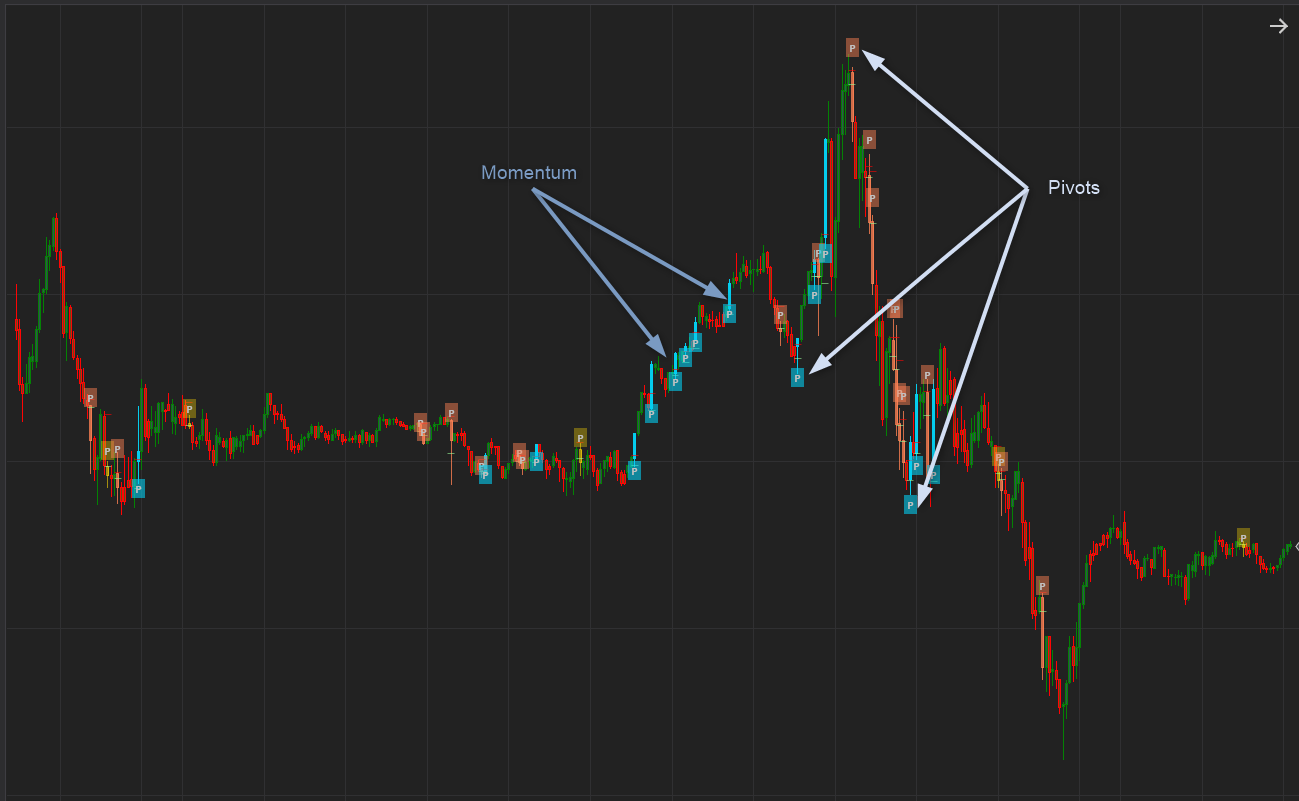
These bars shows us levels of support and resistance, little interest, bars of great momentum and very often great Pivot Points!
Strategy Development
Power Signals was developed to help us better develop trading systems. We define 3 steps:
1) Interest Bars / Power Signals
We start this process by identifying the interest bars. Since we generally develop momentum, trending or reversion strategies we can use these bars and the context that they present themselves in to better develop a strategy. As a rule of thumb, High interest bars tend to improve momentum strategies and Low interest bars often show pivot points and works well in reversion strategies.
2) Once we have identified these bars we look at the micro context, the short term metrics like higher , highs, lower lows and more.
2) Next we look at the Macro context, Is the market trending, range bound, overbought / oversold.
3) Finally, we define the type of strategy that we want to develop, Momentum, Reversion, Trending.
Let`s elaborate and explain this further …
Power Signals
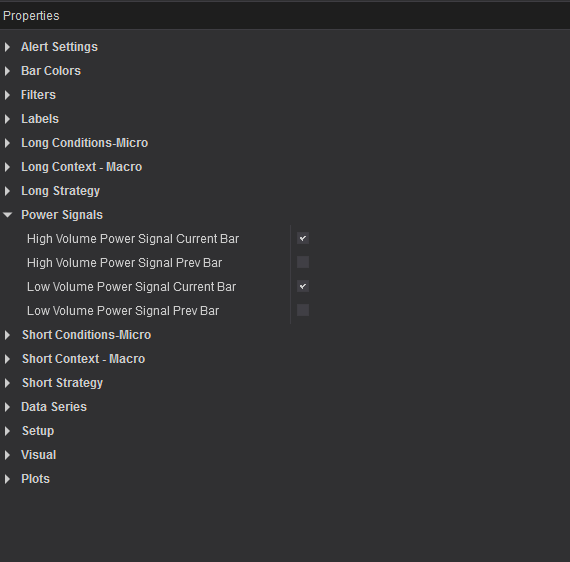
We get High interest and Low interest signals. With this setting you can select if you want to act on a signal in the current or previous bar. You can also select between High versus Low interest signals.
The challenge when developing a trading strategy is to determine when the market will revert back and when it will continue in its current direction. For this we have to look at the micro and macro market context. We also look at the type of strategy that we would like to trade, either Reversion, Trending or Momentum.
- Context – Short term / Micro
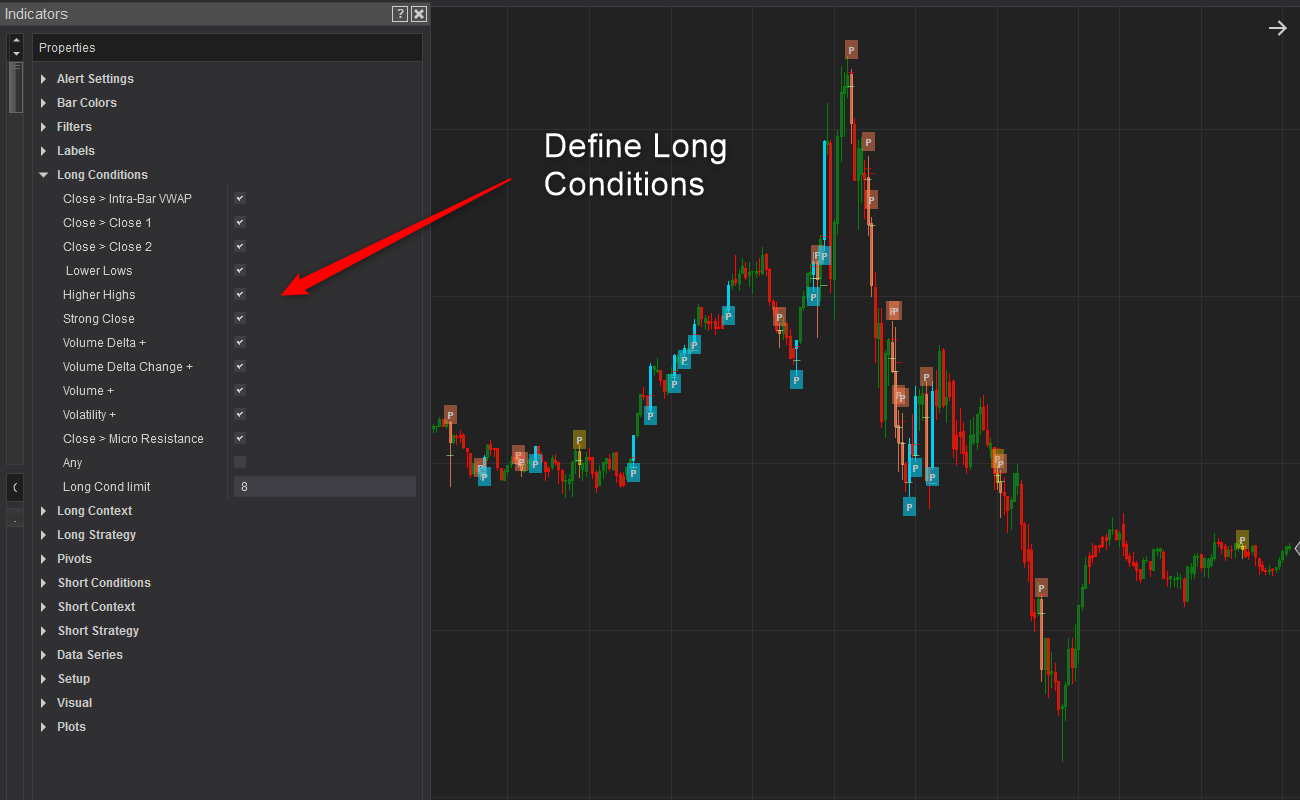
Here we look at what the market is doing during the current and previous bars. This is also the trigger for the strategy. We have added a whole lot of sensible conditions that you can select / choose from to define the first part of the strategy.
The 11 conditions are:
- Close > Intra-Bar VWAP
- Close > Close (previous bar)
- Close > Close (2 bars Back)
- Higher Lows -> Lows moving higher
- Higher Highs -> Highs moving Higher
- Strong Close -> Close > midpoint between high and low
- Volume Delta + -> This is the intra-bar volume delta ( More buying or selling volume intra-bar)
- Volume Delta change -> Did the Volume Delta increase in this bar compared to the previous.
- Volume + -> Did the Volume increase in this bar
- Volatility + -> Volatility increase ( ATR > ATR1)
- Close > Micro Resistance -> Here we look if the Close is above the intra-bar resistance for the last 2 periods.
This setting allows you to select the conditions that you require to be true Before a P – point will be plotted. These are AND conditions. All the selected conditions must be true before the signal is given.
You can select from 1 to all 11 conditions that needs to be true.
You can also select some or all of them and then set the “Long Condition Limit” value to a number less than you have selected to create an OR condition. Example: If you have selected 11 conditions and set this to 8, Then if ANY 8 of them are true, the signal will plot. If you select 4 conditions and set this limit to 4, then all 4 must be true.
The reverse of the above applies to the short conditions
2) Context – Longer term / Macro
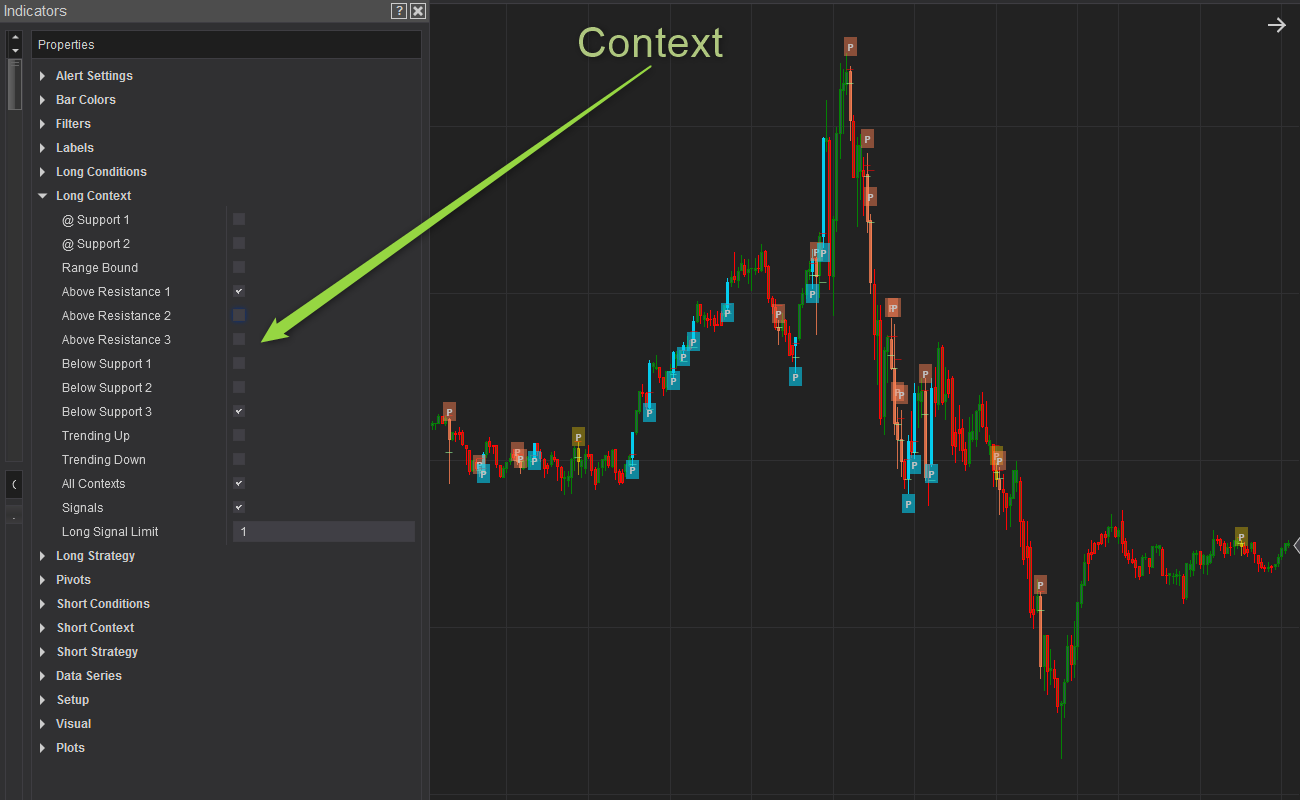
Here we filter for certain market areas rather than conditions.
- At Support / Resistance ->Here it looks to see if the Close is at the Most recent pivot low (support) or high (resistance)
- At Support / Resistance 2->Here it looks to see if the Close is at the Second most recent pivot low (support) or high (resistance)
- Range Bound -> The market is in a range , between Pivot High and Pivot Low.
- Above Resistance 1 -> The market is above the nearest Pivot High.
- Above Resistance 2 -> The market is above the Second nearest Pivot High.
- Above Resistance 3 -> The market is above the 3rd nearest Pivot High.
- Below Support 1 -> The market is Below the nearest Pivot Low.
- Below Support 2 -> The market is Below the Second nearest Pivot Low.
- Below Support 3 -> The market is Below the 3rd nearest Pivot Low.
- Trending Up -> Higher Highs and Higher Low Pivots.
- Trending Down -> Lower Highs and Lower Low Pivots.
3) Strategy
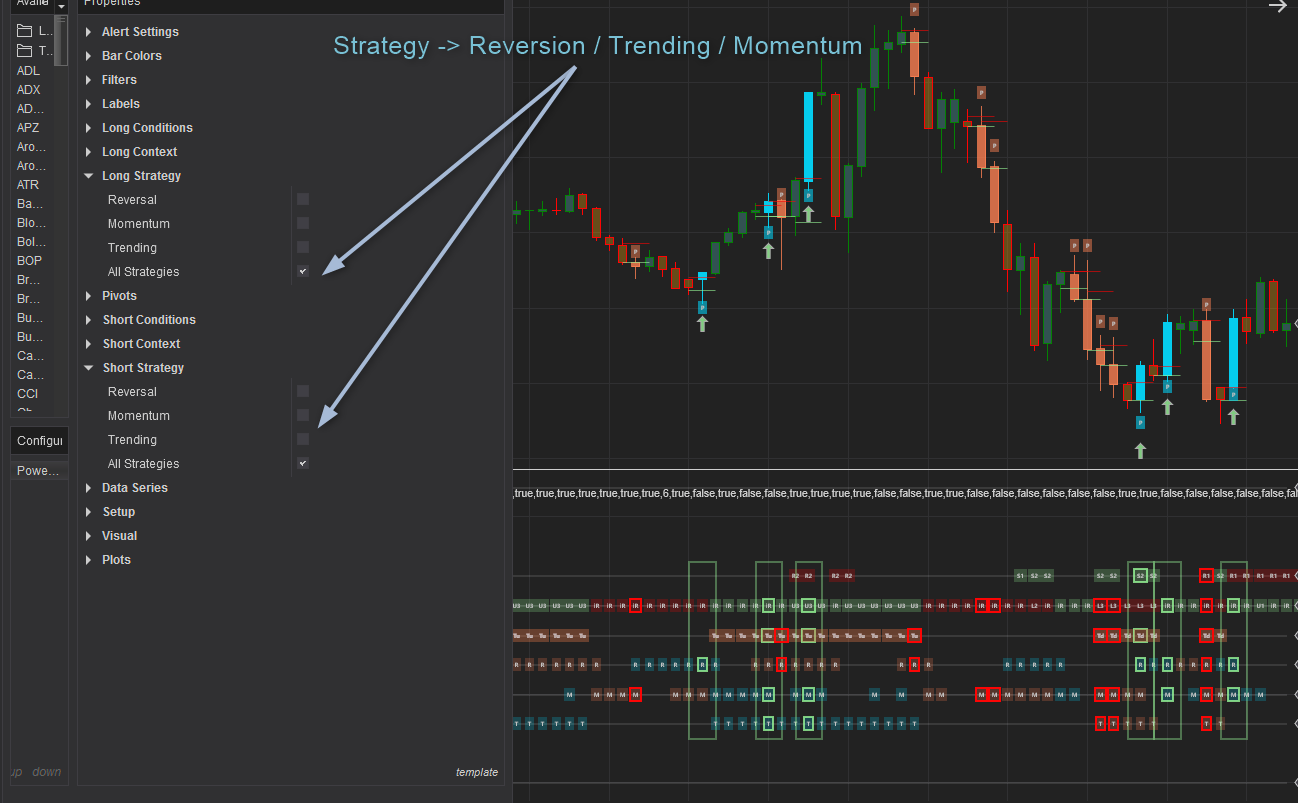
With this setting you can filter the strategy that you would like to trade:
- Reversals -> The trend is down and the market is overbought / oversold.
- Trending -> The trend is up / down
- Momentum -> The trend is up/down and the trend is making new highs / lows.
- All Strategies -> With this selected the indicator will not filter for the above and all strategies will signal.
Putting it all together…
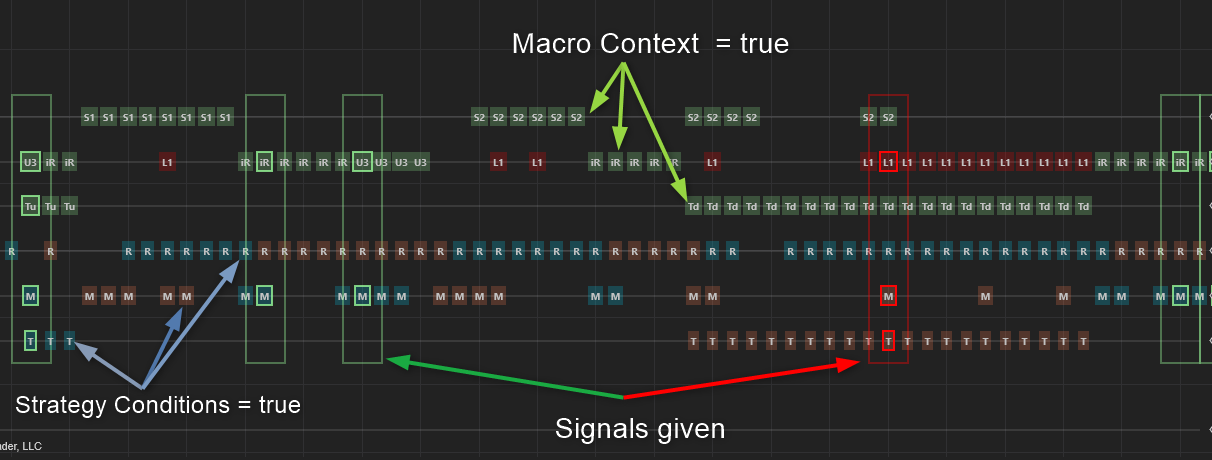
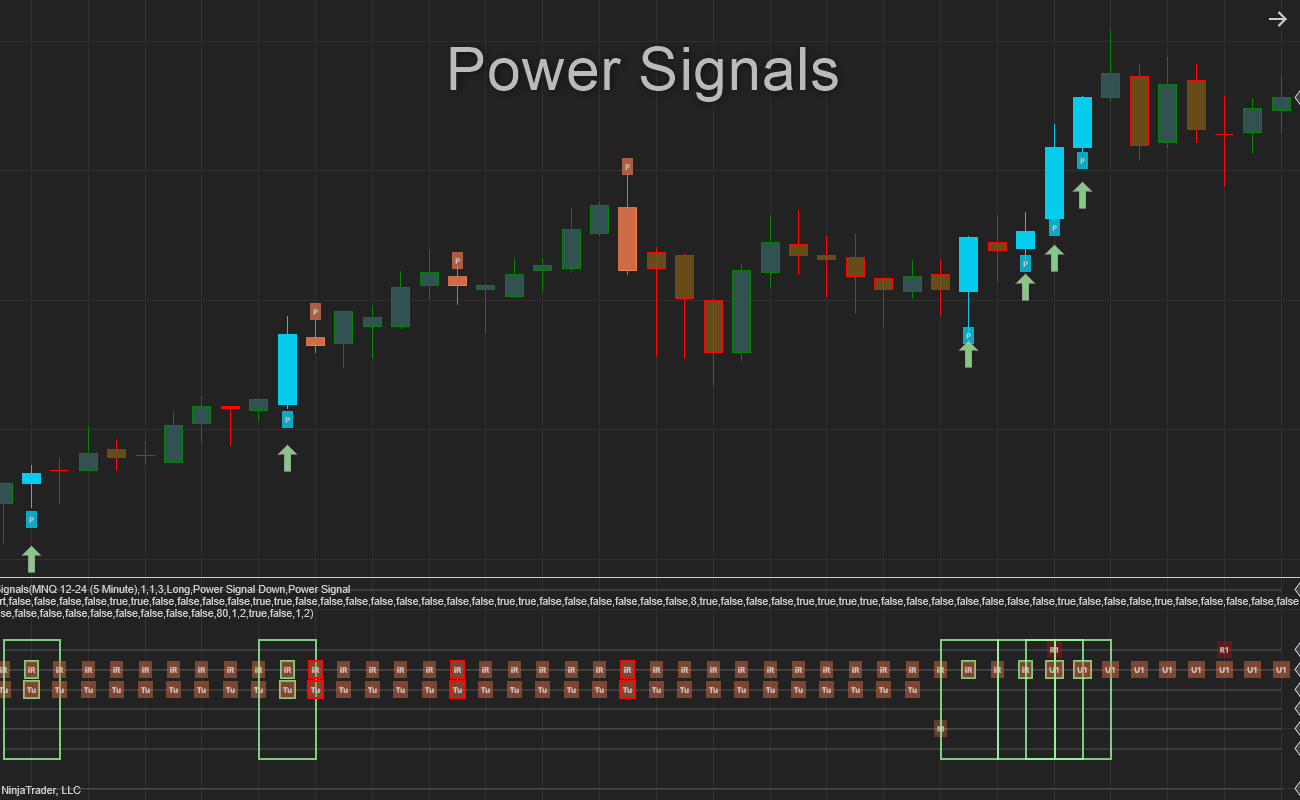
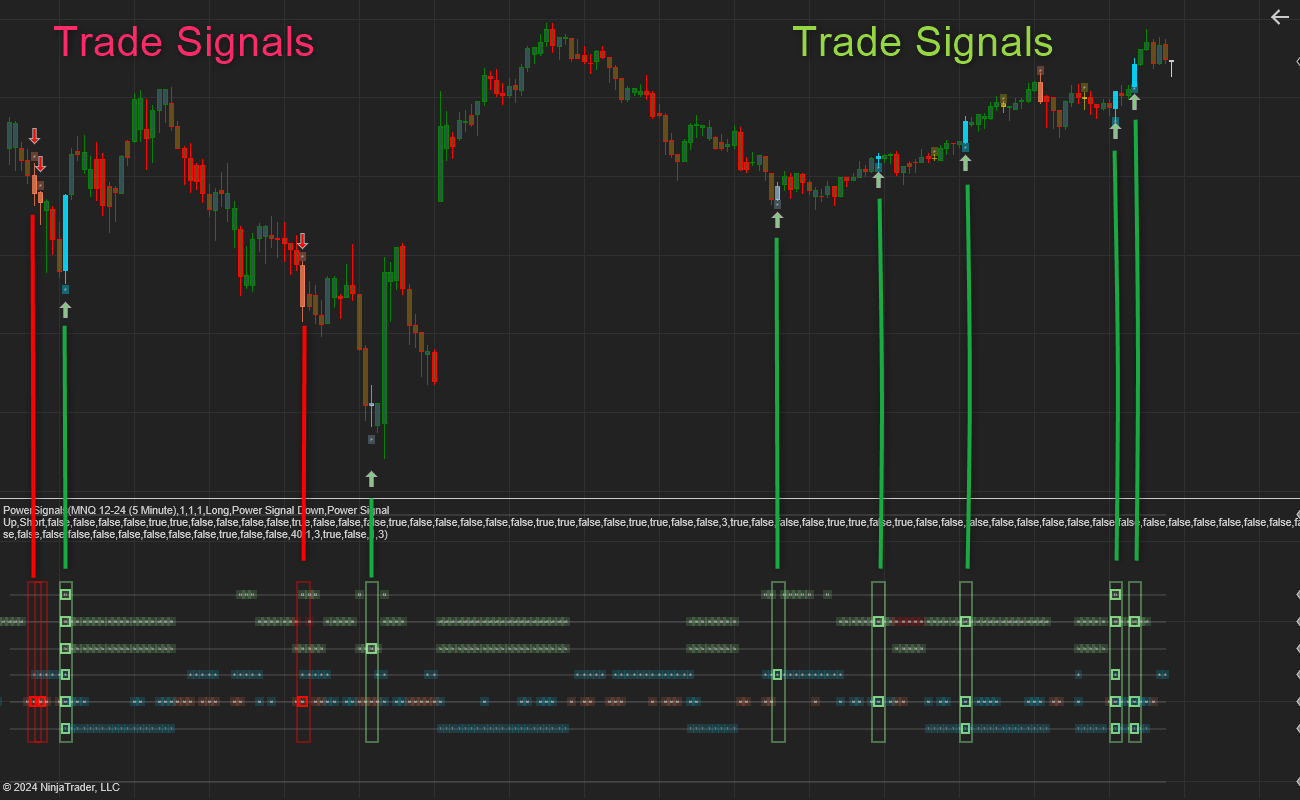
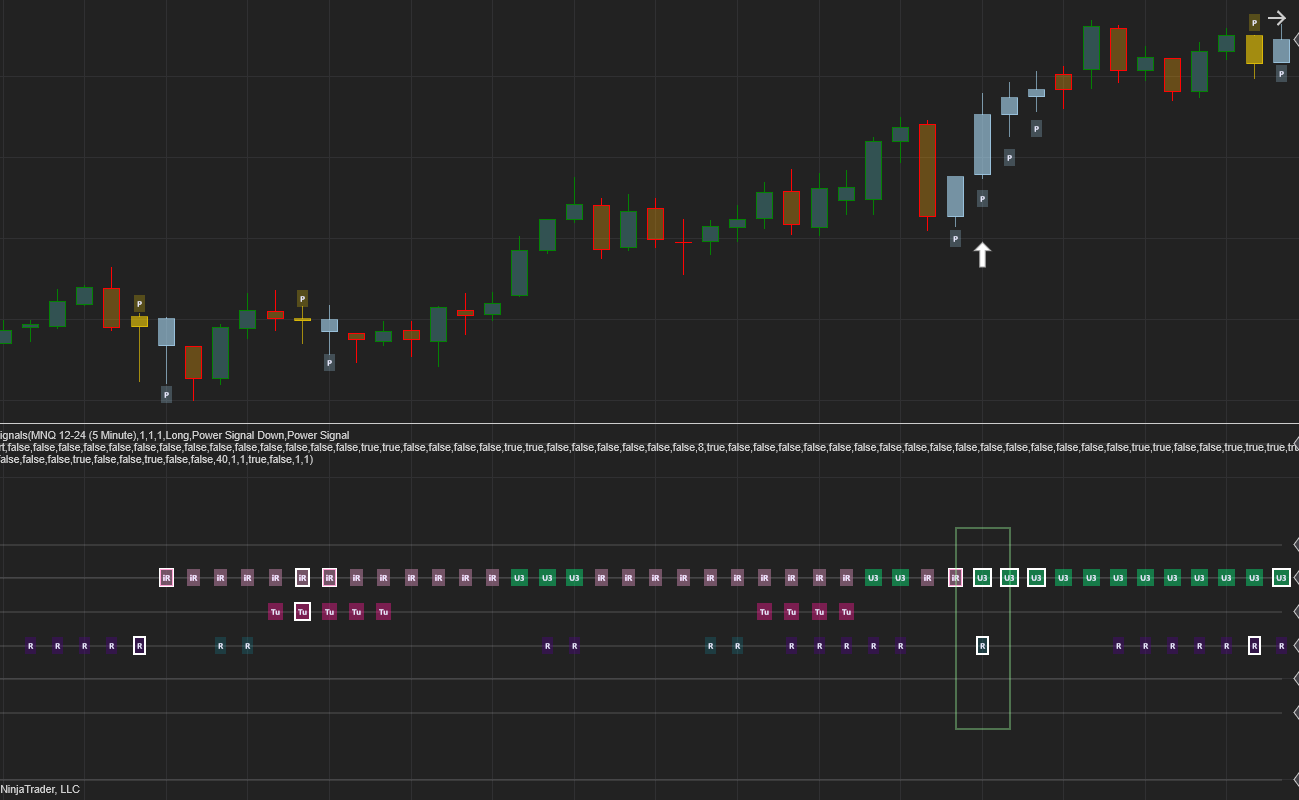
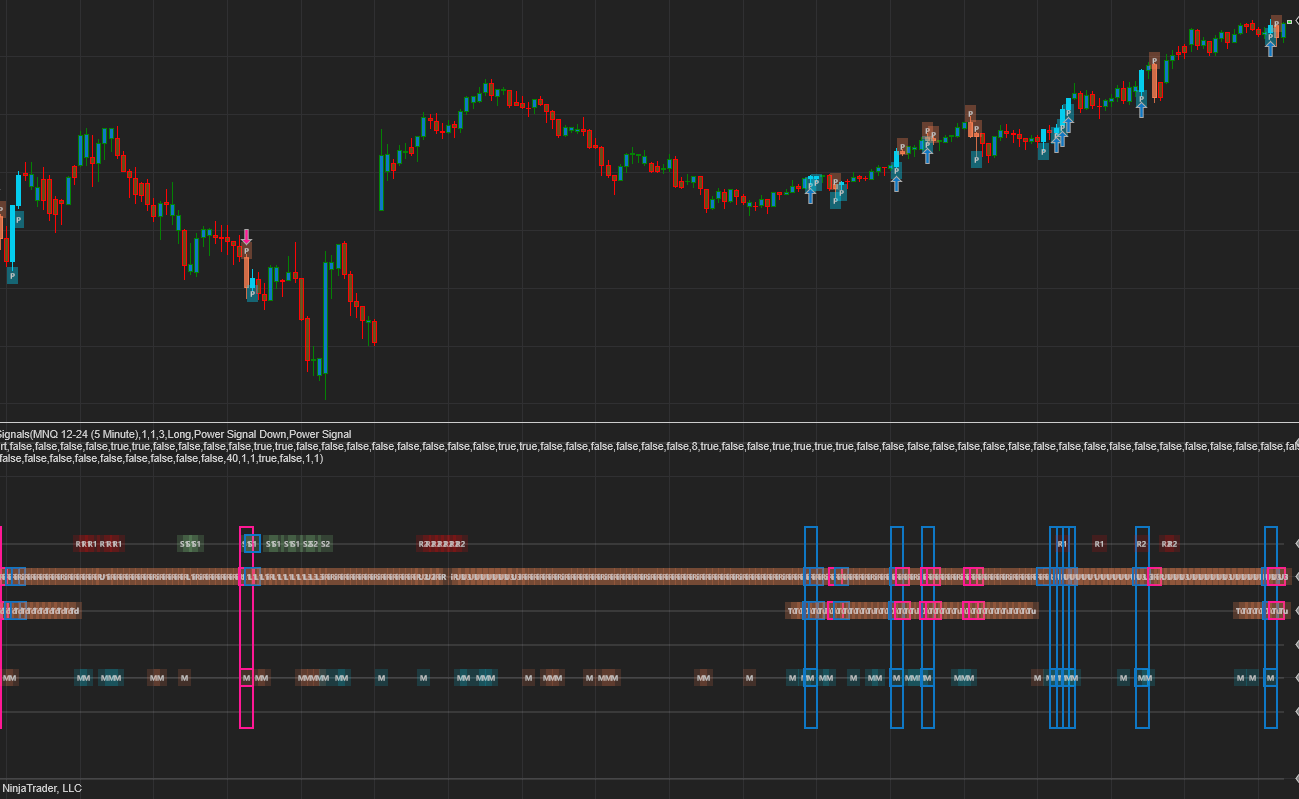
We have added a dashboard that will plot above / below the price plot.
It gives you a great overview of the market conditions that you have selected. Only the Macro context and strategy conditions show up here. The micro conditions are quite visible generally on the price chart so there is no need to display them here. They are shown with the signal markers on the price chart when a signal is given.
When a condition is selected And is true, the appropriate signal will display on the dashboard.
When a Power Signal is generated with the micro context signals the selected and true signals “light up” ( The outline color changes )
When all the selected conditions are true and the Power Signal fires, a rectangle is drawn on the dashboard indicating that either a long or a short signal has been generated. At this point an arrow up or down is also plotted on the price chart. See below
Strategy design
You can potentially develop 100`s of different strategies with this tool and then simply save all the templates creating multiple strategies for multiple instruments and time frames.
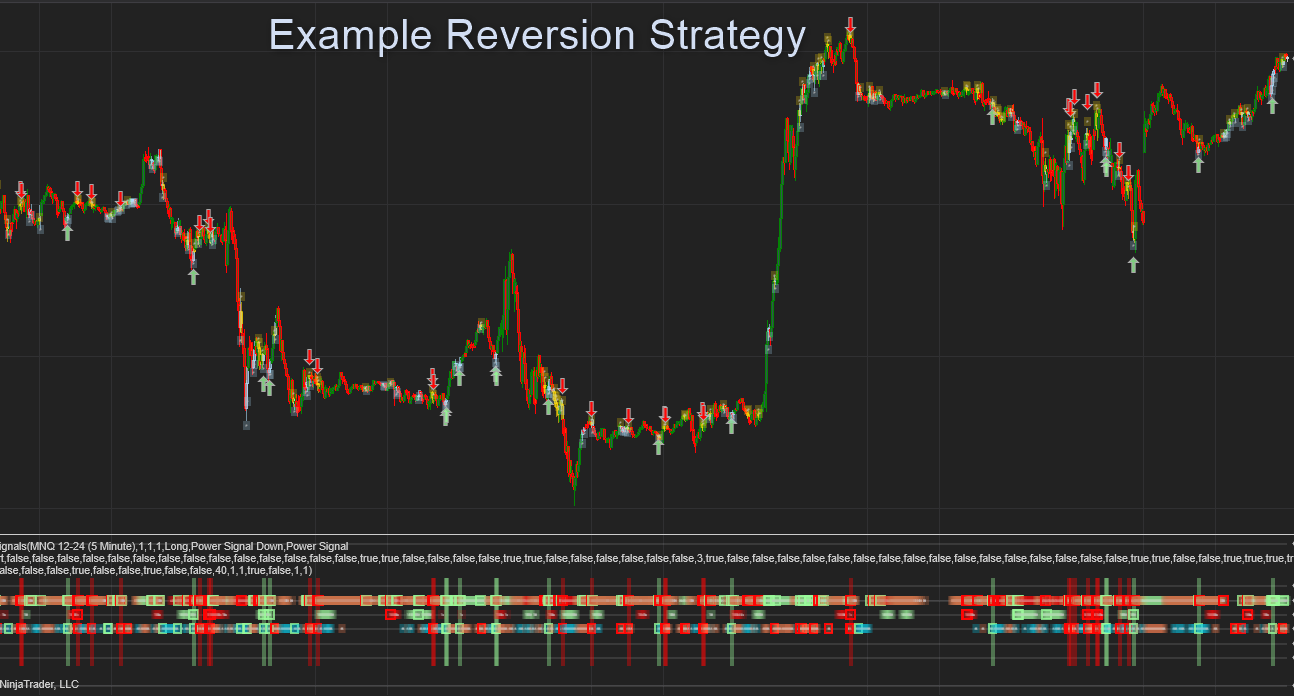
By adding filters for the market context and strategy we can filter out many bad trades. As an example, you don’t want to trade reversion when the market is breaking out and roaring upwards. Similarly you don’t want to trade momentum when the market is stuck in a range.
Below is just 2 simple and quick strategies that we have put together. We are sure you will be able to develop far better strategies than these!
Reversion Strategy
Momentum Strategy
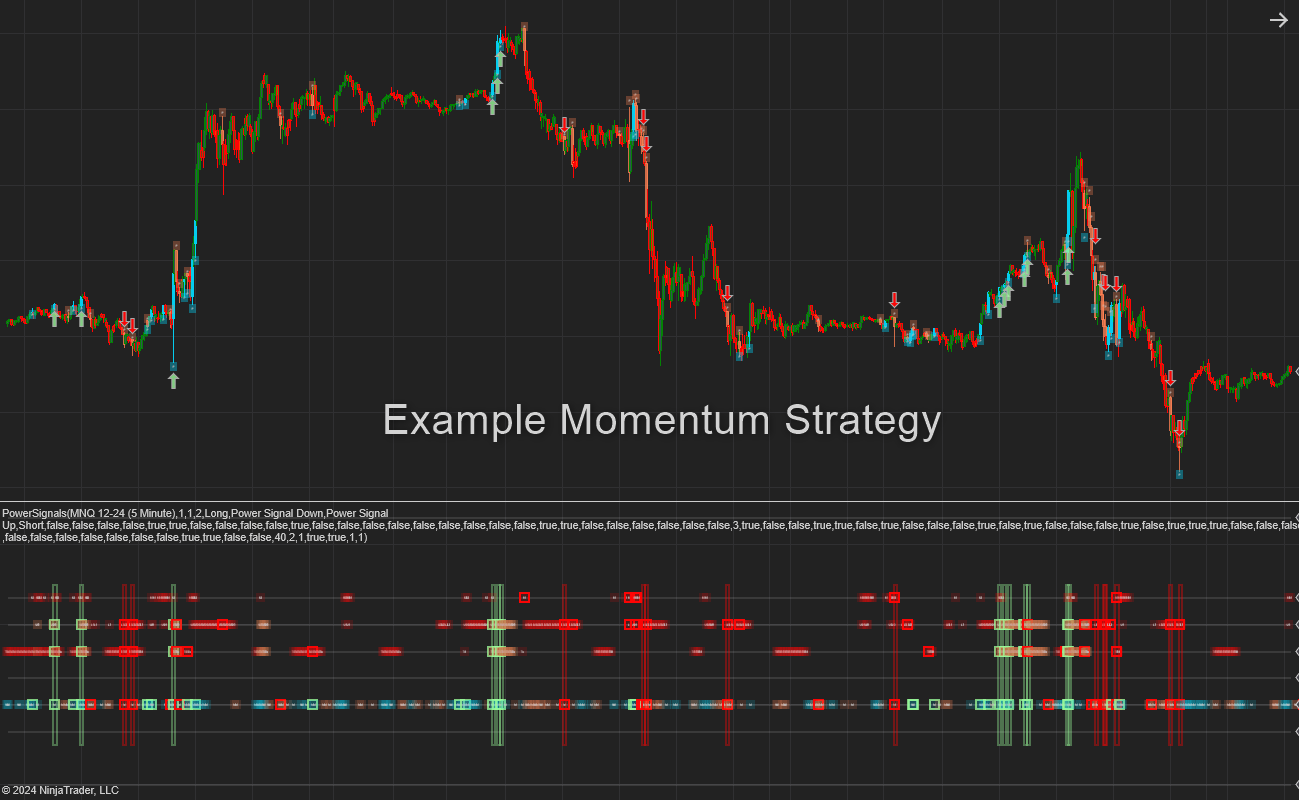
Not only are the power signals useful but also the dashboard as it paints a good picture of the current market trend and context.
Display Customisation
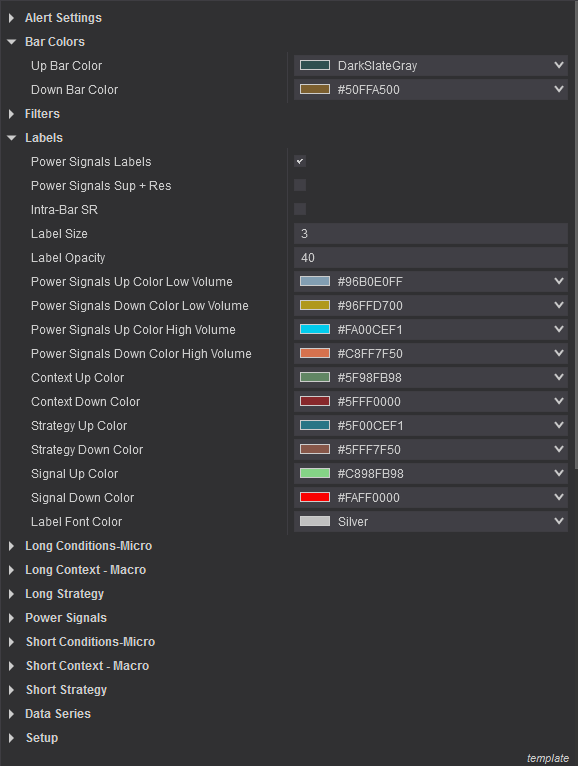
You can change most of the colors of the labels, plots and bars.
Change the size of the labels
has been added to your cart!
have been added to your cart!