Q-Curve
Q-Curve
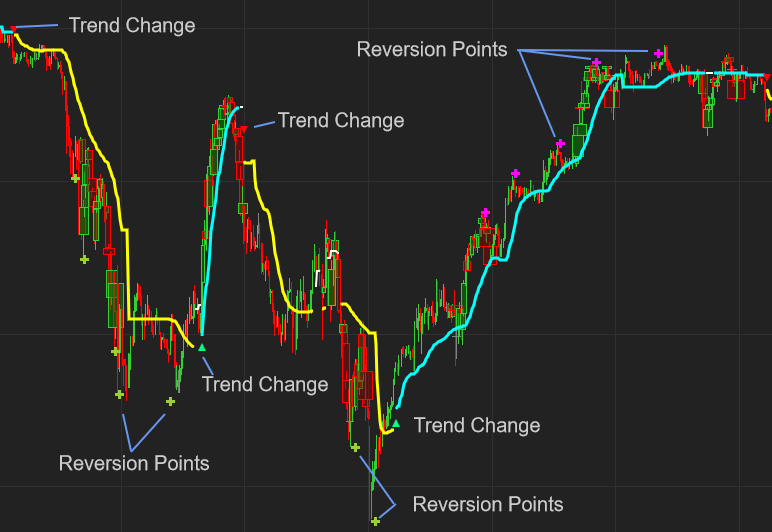
Q-Curve is a trend following indicator that looks for reversals.
Entries
We need a long consistent trend in the same direction to start. We then look for the reversion points to appear on the chart. These points indicate when the market is finding resistance after an extended trend.
Once the trend change arrow is drawn we can enter our trade.
Exits
We can exit our trades at pre-defined profit target levels or wait for a trend change to occur. A combination of profit target levels and a trailing stoploss works well. You can exit a percentage of your position at the profit target level and ride the balance of your position until your trailing stoploss is hit or the trend changes direction.
When the reversion dots appear it signals resistance building up and you can set you trailing stoploss closer.
Support and Resistance levels make very good profit targets. Our QSR Indicator is perfect for this. You can learn more about it at the bottom of this page.
Settings
You can change the value of the settings between 0 – 2. Smaller values looks for faster trend changes with less filtering and vice versa. Feel free to find the settings that works best for you.
Testimonials appearing on this website may not be representative of other clients or customers and is not a guarantee of future performance or success.