Q – Profile
🔥 Heat and Trend Profile Indicator: Volume Profile and Trend Detection Reinvented
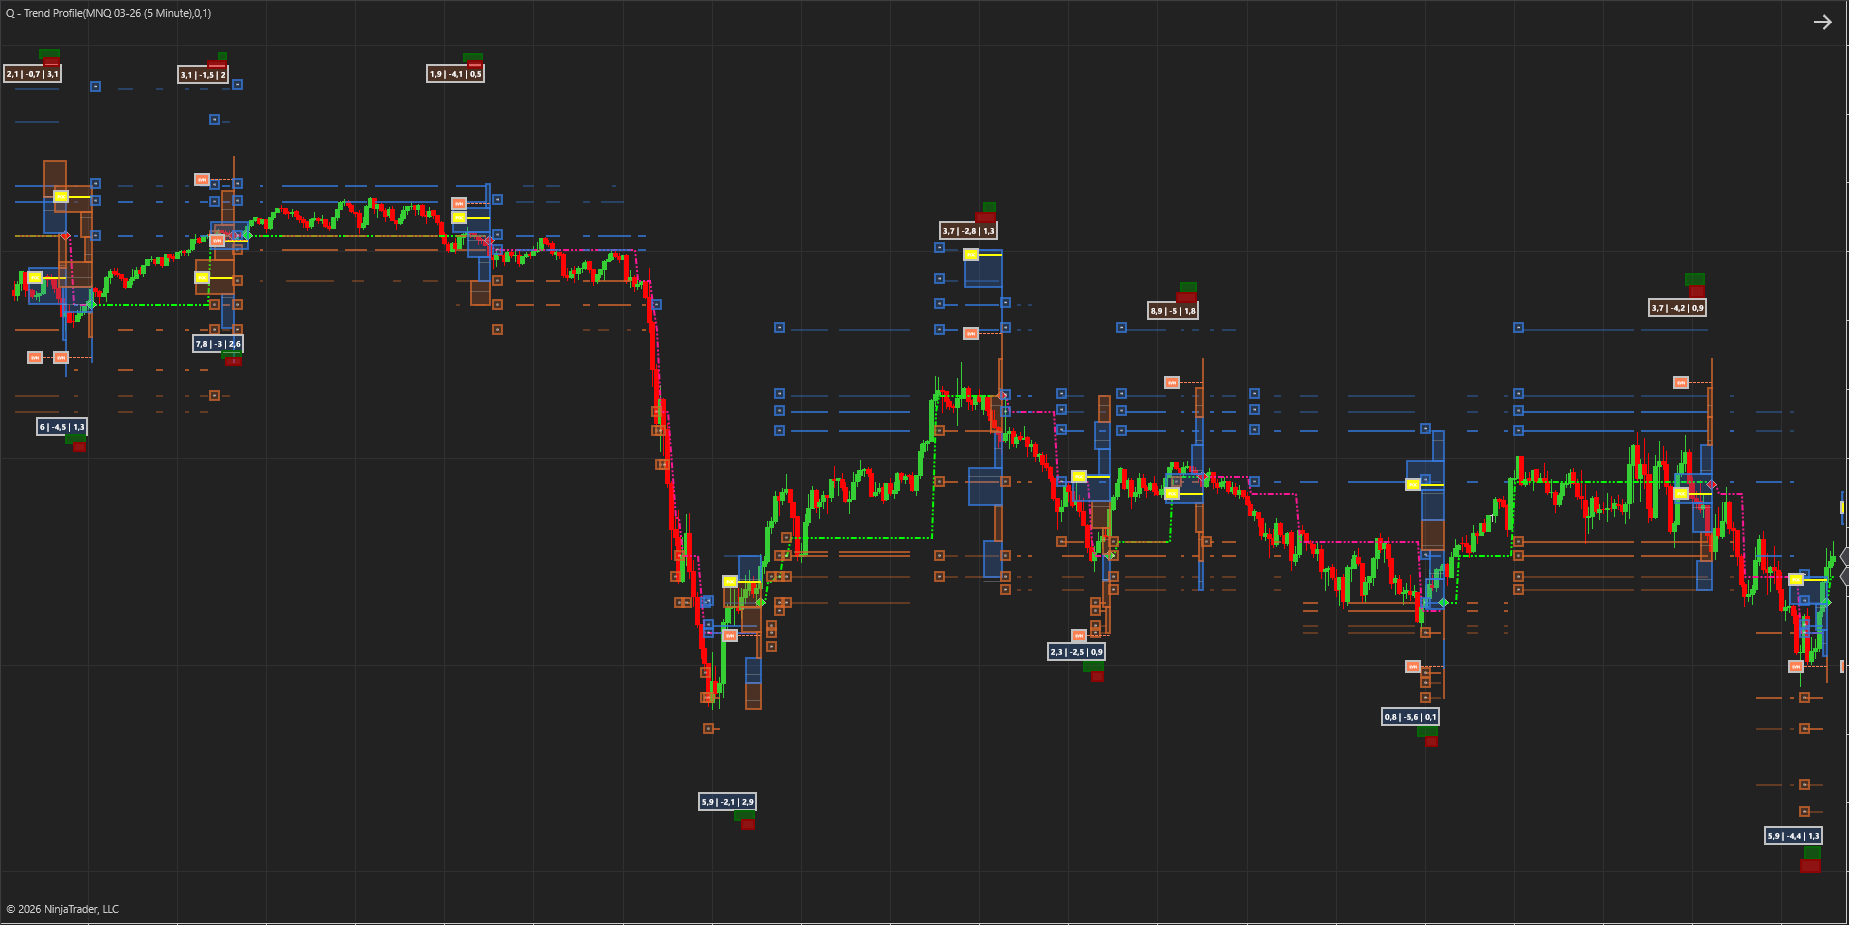
The Q-Profile Indicator combines the power of Volume Profile with dynamic trend analysis, support, and resistance — giving traders a smarter way to see where the market truly values price.
What makes it different?
Traditional volume profiles simply stack raw volume at each price level. That’s useful, but it doesn’t tell you who is trading or how the market is behaving. We’ve taken a new approach:
- Smart Money Filter: Our algorithm separates institutional‑grade “smart money” volume from the rest, so you see where the real market movers are active.
- Three Pillars of Heat: We combine smart volume, delta (buy vs. sell pressure), and volatility into a single Heat Value. This creates a profile that reflects the true activity.
- Delta Value: We calculate the net delta at each level and color code the bins accordingly
We call this a Heat Profile — a more intelligent version of volume profile.
Adaptive Trend Profiles
The indicator doesn’t just plot static distributions. It learns from each profile:
- It starts by defining an initial trend.
- When the trend changes, the profile resets. Calculates the Point of Control ( POC ) and Low Heat Level ( LHL ) and the Value Area ( VA )
- Each reset incorporates what was learned from the last Heat Profile — determining Support and Resistance levels , refining trend detection and improving accuracy over time with the inputs from the POC, LHL and VA.
This creates a feedback loop: every profile teaches the indicator more about how the market is behaving, so your trend analysis gets sharper with each shift.
Why traders love it
Edge: By filtering for smart money and combining delta + volatility, you’re trading with deeper insight into market structure.
Clarity: See value areas, POC, Low heat areas and support/resistance levels that actually matter. Define the trend significantly better than any standard trend detection regime or indicator
Adaptability: Profiles reset at trend changes, keeping your chart clean and relevant.
🛡️ Adaptive Support & Resistance
The Heat Profile doesn’t just highlight value areas — it extracts precise support and resistance levels from the distribution of smart money volume, delta, and volatility.
Dynamic Lifecycle of Levels
- Derived from Heat Profiles: Each profile generates S/R levels based on where institutional activity concentrated.
- Saved while relevant: These levels remain active on your chart as long as the market respects them.
- Removed when invalidated: Once price action proves a level is no longer significant, it is automatically cleared. This keeps your chart clean and focused only on relevant zones.
Feeding Back into Trend Discovery
- Every time a trend shift occurs, the Heat Profile resets.
- The S/R levels from the prior profile are evaluated: those still respected are retained, those broken are discarded.
- The surviving levels are fed back into the trend engine, sharpening its ability to detect and confirm new directional moves.
- This creates a continuous learning loop.
Why this matters
- No clutter: You only see levels that the market is actively respecting.
- Self‑cleaning charts: Outdated zones fade away automatically.
- Smarter trend signals: Because the indicator learns from which levels held and which failed, your trend discovery grows more accurate over time.
🔥 Heat Cycle Comparison
The Heat Profile also incorporate a signal that displays the Heat for the most recent cycle compared to the previous cycle when the trend flips.
Relative scaling: The widths of the rectangles are scaled against each other, so you instantly see which timeframe’s heat is dominant.
🎯 Position Meter: Risk‑Reward in Deviations
The Position Meter is a built‑in diagnostic that calculates shows how price sits between two key reference levels in terms of a Z score.
What it shows
- Upper Deviation: How far price is below the closest upper resistance, expressed in standard deviations.
- Lower Deviation: How far price is above the closest lower support, also in deviations.
- Risk‑Reward Ratio: A normalized metric that compares the distance to potential reward (resistance) against the distance to potential risk (support).
Why it matters
- Statistical grounding: Distances are expressed in deviations, making them adaptive to volatility.
- Instant bias check: See whether price is leaning toward resistance or support.
- Risk‑Reward clarity: The ratio gives you a fast read on whether the trade setup offers favorable reward compared to risk.
This indicator is fully customizable in terms of calculation methods and visualisation.
⚙️ Display Settings
- T‑Stop Long / Short: Toggles trailing stop visualization for long and short trades. Helps you see where protective stops are placed.
- Dashboard: Enables the on‑chart dashboard with key metrics.
- Dashboard Size: Adjusts the font/box size of the dashboard for readability.
- Volume Relative: Plots the relative volume of the current cycle versus the previous.
- Text Color: Sets the color of dashboard and label text.
📏 Display Settings – Support & Resistance
- Plot SR Lines: Turns on/off automatic support and resistance lines derived from Heat Profiles.
- SR Proximity: Defines how close price must be to an S/R level before it’s displayed. Levels too far from the current price stretches your chart and aren’t close enough to be relevant , thus we can only display them when the price is close enough
- Plot SR Labels: Shows text labels on each S/R line for clarity.
- SR Label Size: Adjusts the font size of those labels.
📊 Display Settings – Heat Profile
- Bin Outline Color Up / Down: Colors for the outline of volume bins based on the delta for that level.
- Fill Color Up / Down: Fill colors for the bins.
- Fill Opacity: Controls transparency of the heat profile fill.
- POC Color: Sets the color of the Point of Control line (the most traded price).
- Line Width (POC / LVL): Adjusts thickness of the POC and LHL (Low Heat Levels) lines.
- LVL Color: Sets the color for LVL lines, highlighting rejection zones.
- Volume Profile Size: Controls the horizontal width of the profile plotted on the chart.
- Volume Profile Label Size: Adjusts the font size of profile labels.
🔍 Filters
- Heat Filter: Filters out insignificant activity. Values can range between 0 and 1. 1 is the default setting and ideal. Setting this value lower will make the indie more sensitive.
- Trend Filter: Determines how sensitive the indicator is to trend changes.
- Heat Profile Range : This setting defines the price span over which the Heat Profile operates. Instead of using a fixed range, users can choose to base the profile on 1 to 8 price cycles. Each cycle corresponds to a complete trend movement — from initiation to reversal — so the range dynamically adapts to market structure rather than arbitrary price bounds. The Auto setting determines the range based on our custom dynamic algorithm and should be the best setting. We offer more options so each user can customize it to their own preferences.
- Heat Profile Cycles: This setting determines the time duration or lookback period of the Heat Profile, also in terms of cycles. It uses the same cycle logic — each cycle begins and ends with a trend change — allowing the profile to align with meaningful market shifts rather than fixed time intervals. The Auto setting determines the range period based on our custom dynamic algorithm and should be the best setting. We offer more options so each user can customize it to their own preferences. Users can choose to base the profile on 1 to 8 price cycles.
has been added to your cart!
have been added to your cart!