
The Market Structure indicator is designed to decode the underlying rhythm of price movement—revealing transitions between accumulation, expansion, distribution, and contraction phases with precision.
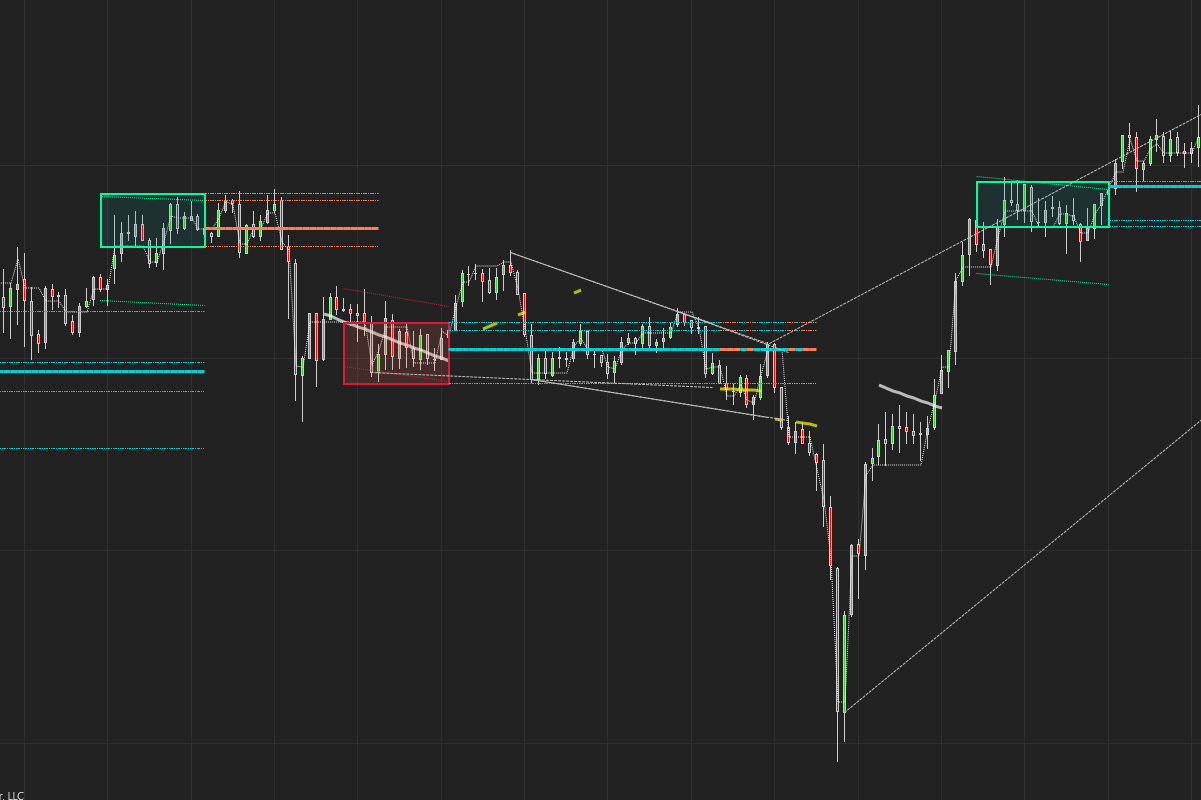
The indicator analyses the current market interest and compares it to previous significant levels of interest. When it finds the current state to be significant it determines a volume profile – type of distribution.
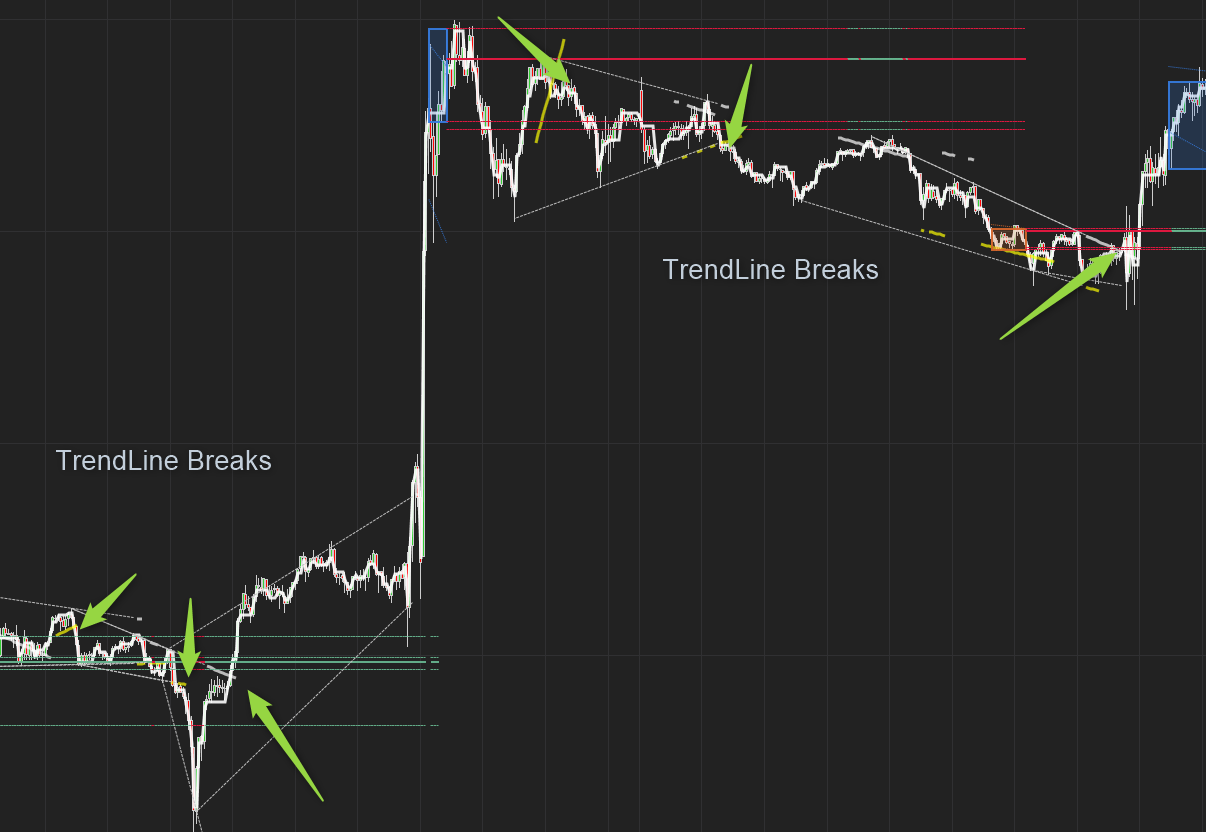
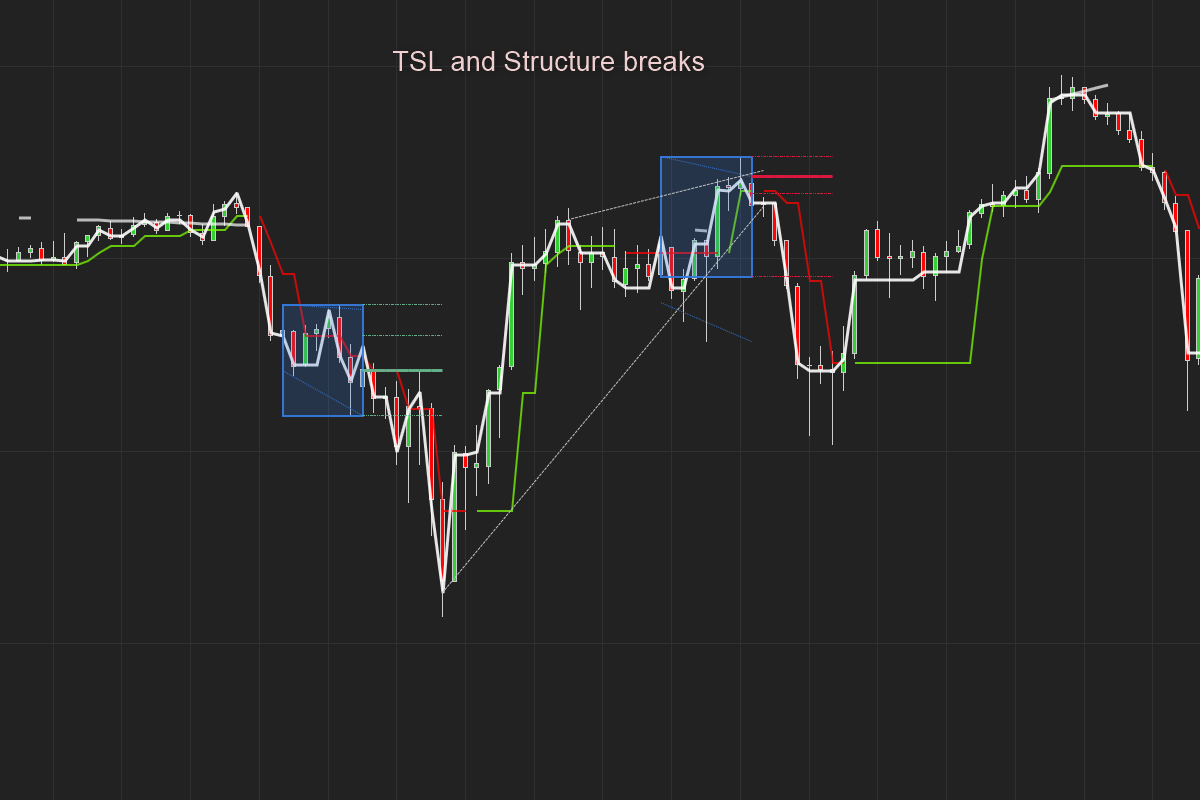
It incorporates Trendlines as these levels also explain the structure of the market. We can clearly see how the market moves in to new areas of consolidation and then breaks of that structure.
It also calculates the Cumulative delta over past and present.

Key Features
 Rolling Volume Profiles: Auto-generates new profiles as structure changes.
- Trendline Integration: Highlights breakout zones and consolidation boundaries.
- Structure Awareness: Reveals accumulation, expansion, and distribution phases in real time.
- No Manual Input: Profiles are generated dynamically—just set your strength threshold.
 Rolling Volume Profiles: Auto-generates new profiles as structure changes.
 Trendline Integration: Highlights breakout zones and consolidation boundaries.
 Structure Awareness: Reveals accumulation, expansion, and distribution phases in real time.
 No Manual Input: Profiles are generated dynamically—just set your strength threshold.
Volume Profile Logic
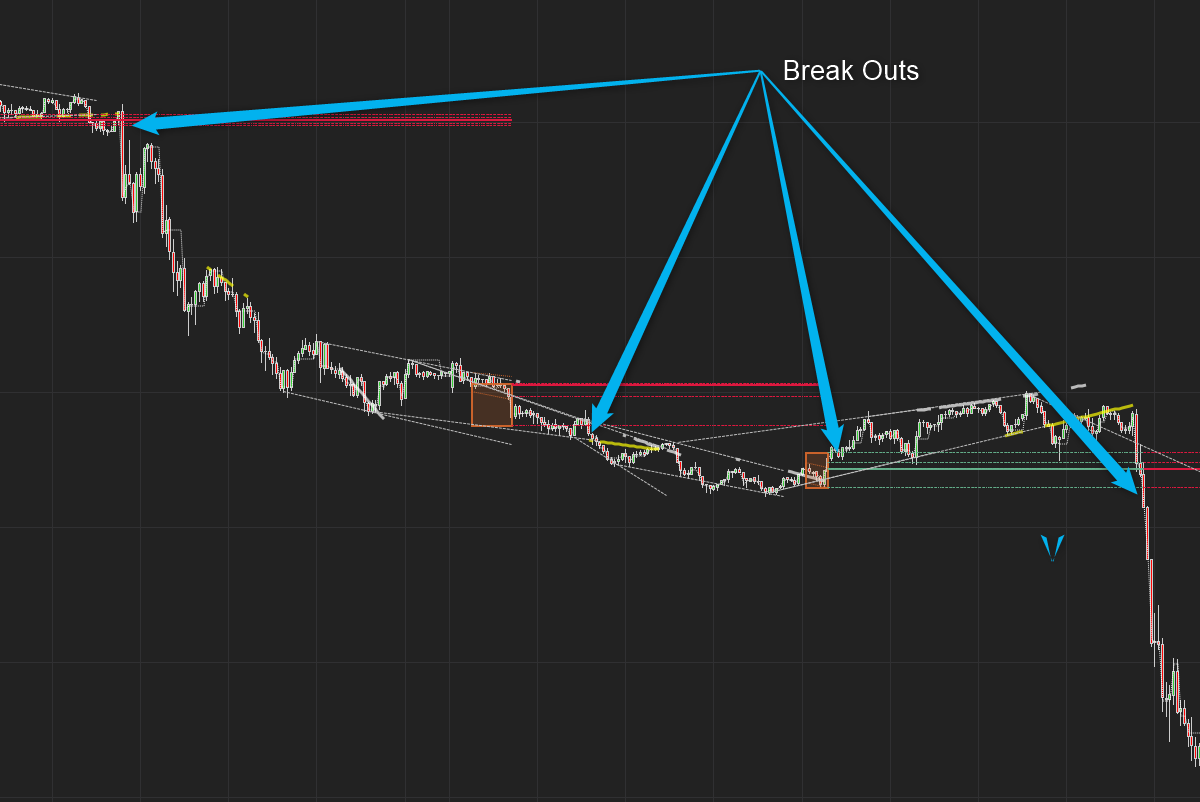
Low Volume Nodes (LVN): Thin zones between HVNs and POCs. Price often moves quickly through these areas—ideal for breakout setups.
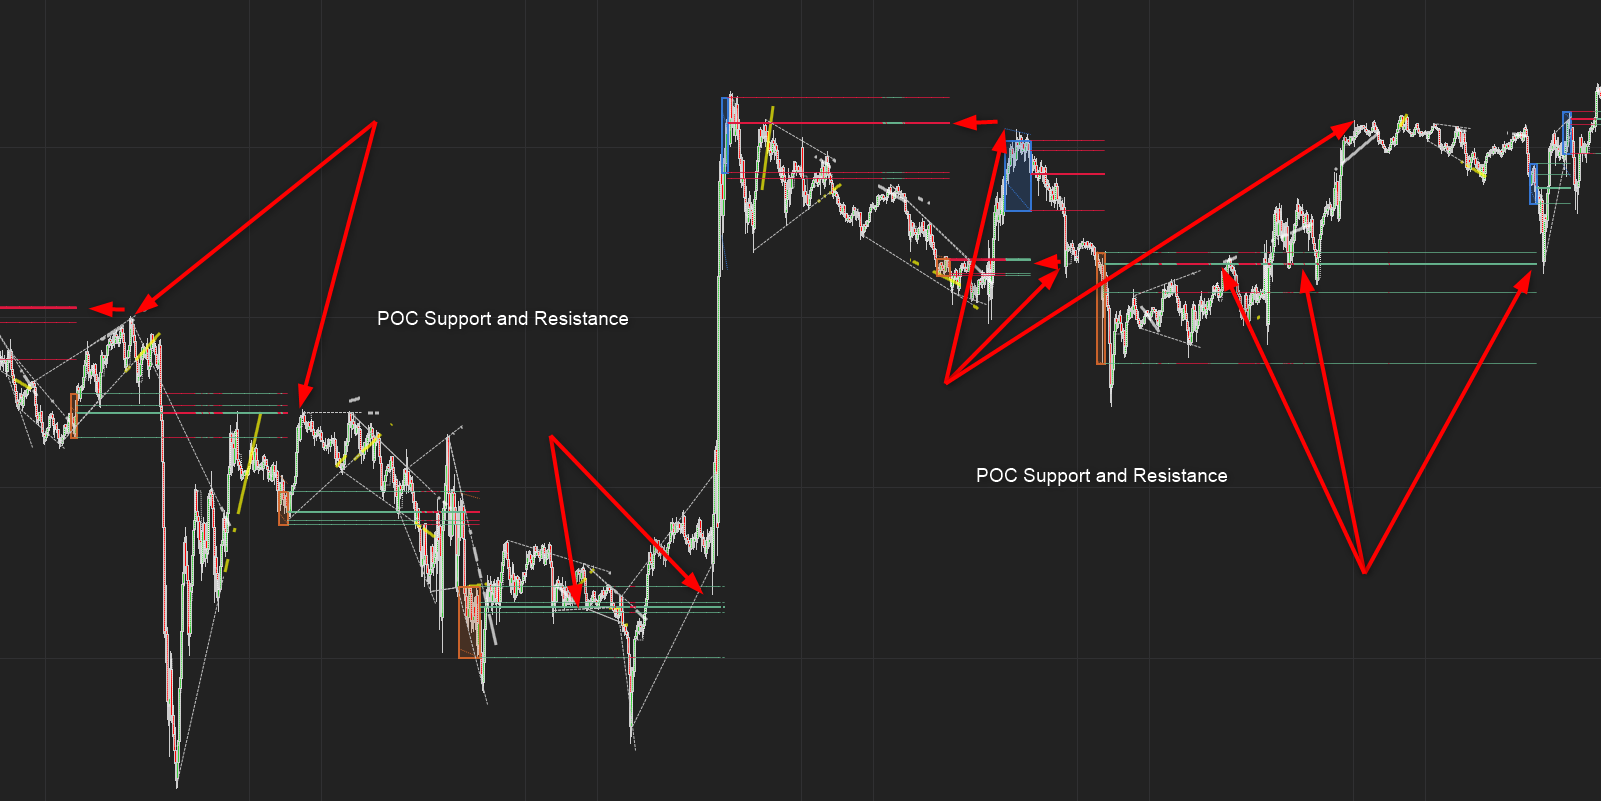
Point of Control (POC): The price level with the highest volume—acts like a magnet. Past POCs often become powerful support/resistance zones.
High Volume Nodes (HVN): Secondary zones of interest. Price tends to consolidate here.
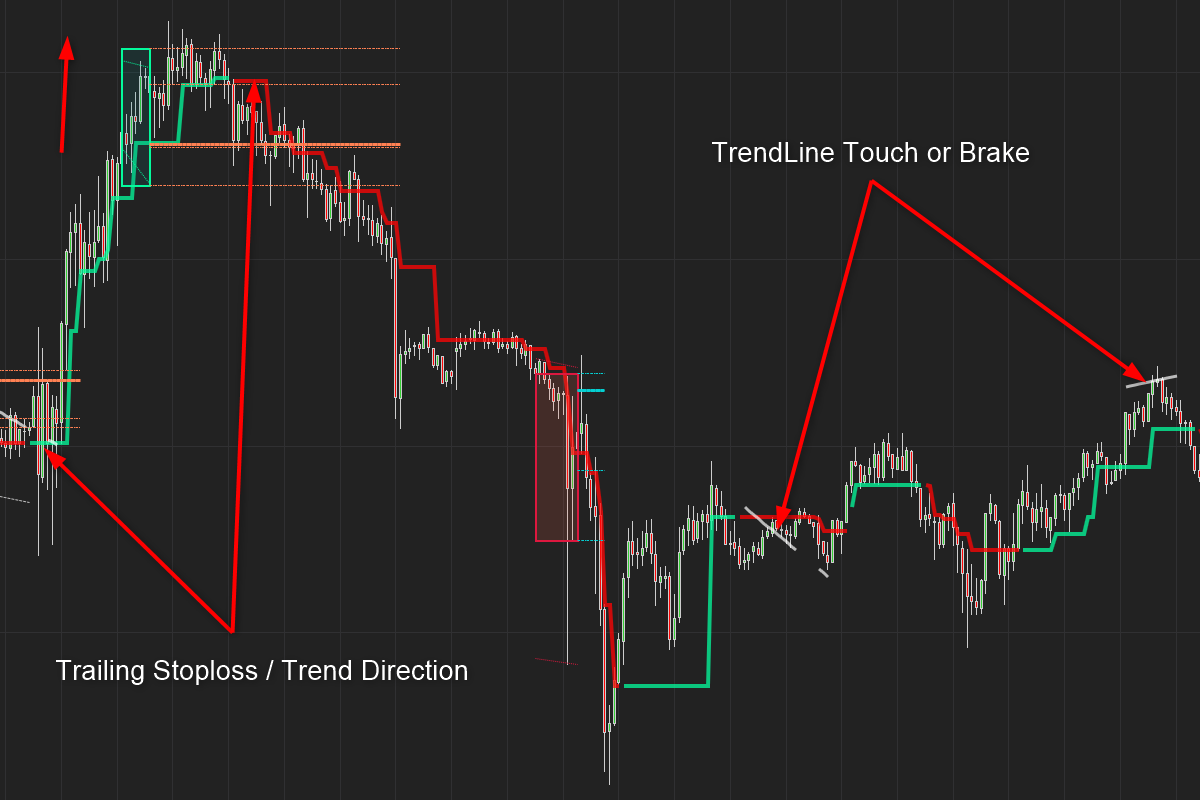
Trends and Trailing Stops
Trendline Breaks: Effective trade setups that signal structural shifts.
Trailing Stop Plot: Use for dynamic exit logic. Adjusts with trend changes, minimizing whipsaw.
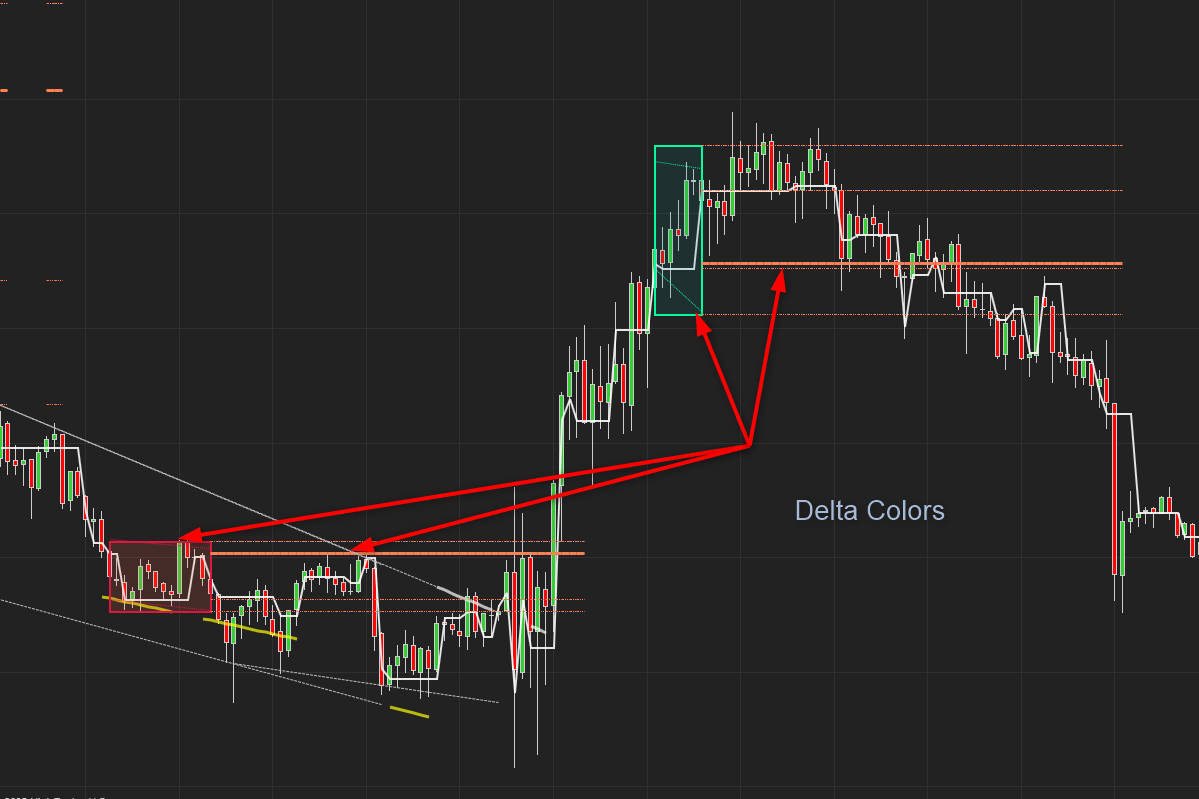
Cumulative Delta
Line Color: Displays current cumulative delta, calculated from the moment a new Volume Profile is formed.
Rectangle Color: Shows past cumulative delta—up colors = buying pressure, down colors = selling pressure.
Micro Structure
Micro Structure Filters
These plots strip away noise and highlight “real”price movement:
MoneyFlow SR: Tracks bars with significant volume.
MoneyFlow Momentum: Tracks bars with significant momentum.
MoneyFlow All: Tracks bars with either volume or momentum spikes.
Use these to detect structure breaks and confirm directional bias.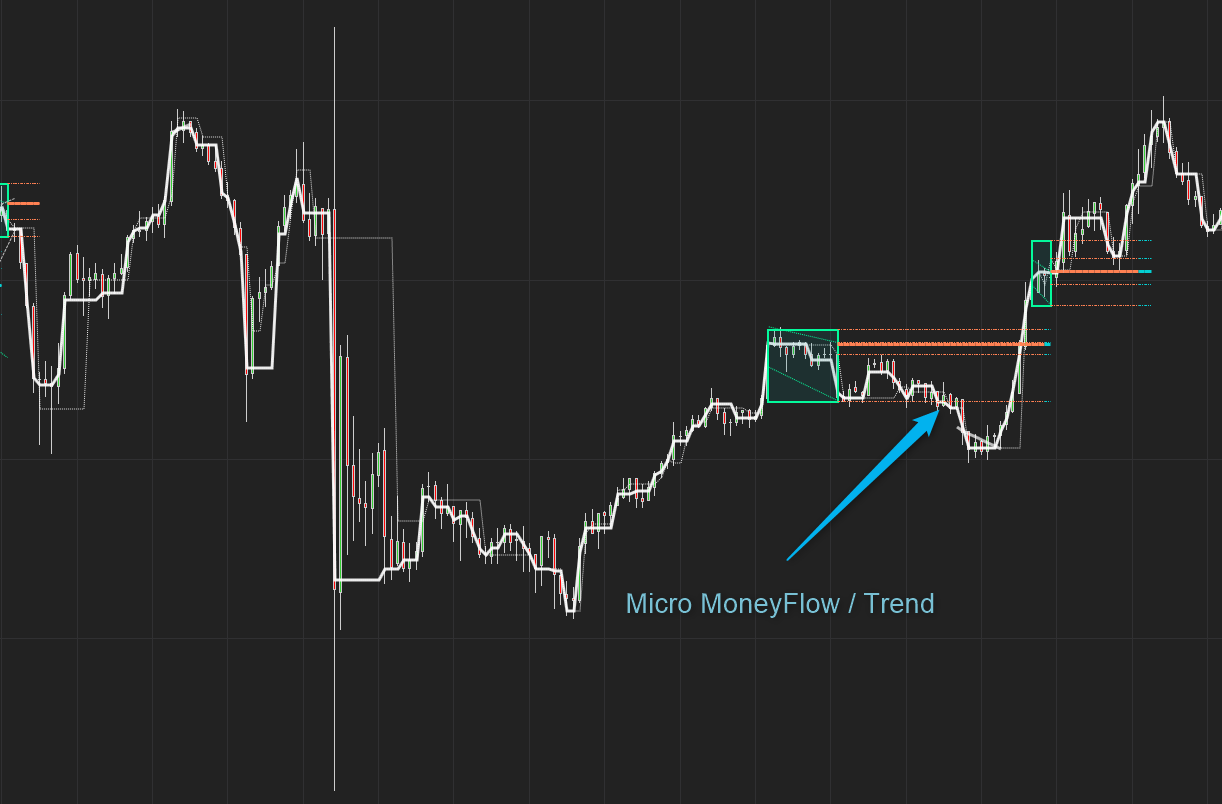
Market Structure Video
How to Use The Market Structure Indicator
Use the Market Structure indicator to trade with context—not just signals. Here are proven techniques and setups that leverage Volume Profile, trendlines, and cumulative delta for smarter decisions.
1) Breakout Confirmation with LVN Zones
Tip: Use Low Volume Nodes (LVNs) as breakout filters. If price breaks into an LVN zone with momentum, it often accelerates due to low resistance.
Use Case: “When price exits a consolidation and enters an LVN, I look for confirmation from MoneyFlow Momentum and cumulative delta to time entries.”
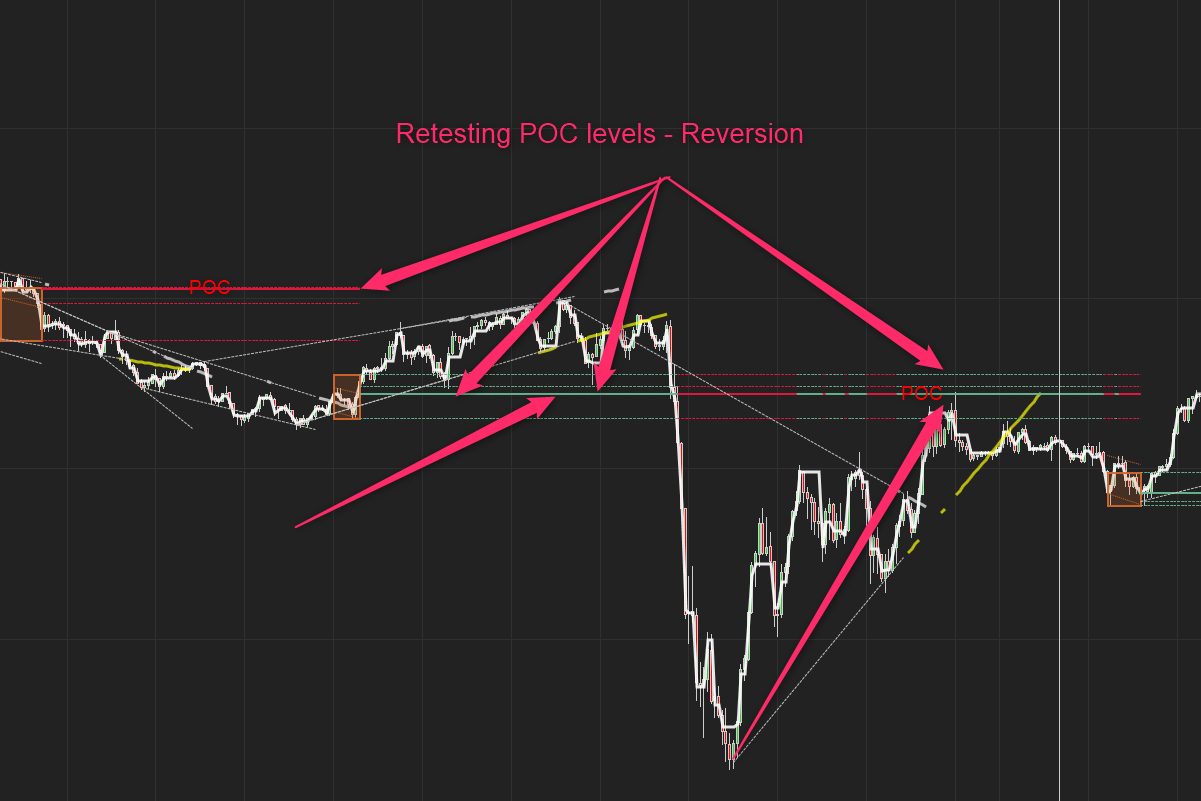
2) Reversion to POC Strategy
Tip: Price tends to revert to the Point of Control (POC) after overextension.
Use Case: “I use past POCs as magnet zones—ideal for profit targets or re-entry setups after failed breakouts.”
3) Trendline Break + Volume Shift Combo
Tip: Combine trendline breaks with a shift in cumulative delta or MoneyFlow SR to confirm structural change.
Use Case: “When a trendline breaks and delta flips from selling to buying, I treat it as a high-probability reversal.”
6) Trailing Stop Logic Based on Structure
Tip: Use your trailing stop plot to exit trades when structure breaks, not just when price retraces.
Use Case: “I let the trailing stop follow the trend until a new profile spawns and delta flips—then I exit.”
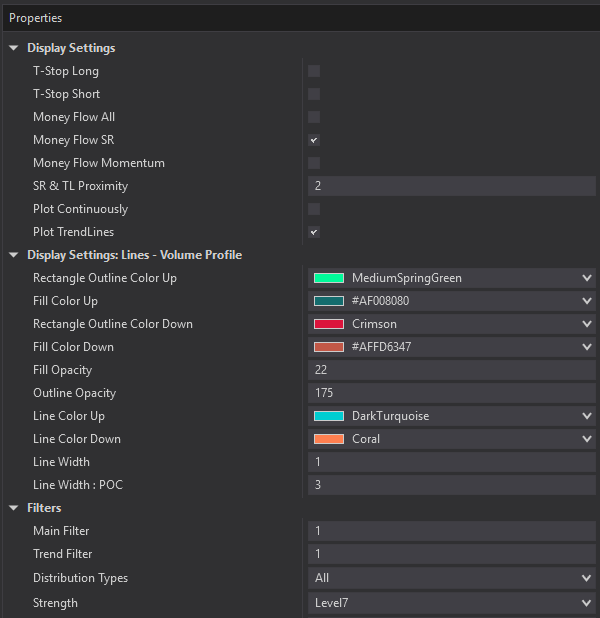
Settings and Customization
Adjust opacity for visual clarity
Toggle any plot On/Off
Customize line colors, width and rectangle fill
Works on All Timeframes and Bar types


