
Money Flow in Action
Market data contains so much noise that makes it hard for us to see the signal in it. We have found that by looking at the volume profile and volatility measures we can track the signal far more accurately.
The Yellow plot in the above image depicts the flow of the signal, the smart money movement. Once we have a better idea of what the signal is we can more accurately determine other values like the mean and deviation. We can also filter out most of the noise in this manner.
The Blue – Gray plot represents the mean of the filtered time series. As you can see this mean adjusts far quicker and more accurately than a moving average would. See how well the price reverts back to this mean.
Another problem with tools like these are the fact that they are time based, (ie. 20 period). We have to FIT the time period to make our indicator look like its accurate. What period should this be 5 / 10 /100000?
This Ninjatrader indicator doesn’t use time as a input but rather let the Signal tell it when to calculate and adjust.
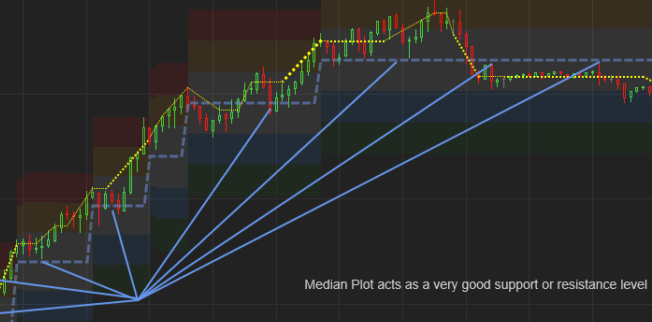
Money Flow – Support and Resistance
Since the market reverts back to the our mean often and predictably, a lot of volume is traded at these levels with little trend making them good levels of Support and Resistance.
Interestingly, the pivot points created by the Signal Line (Yellow) makes for far better pivot points as these are the levels created by the Smart Money and on significant Volume.
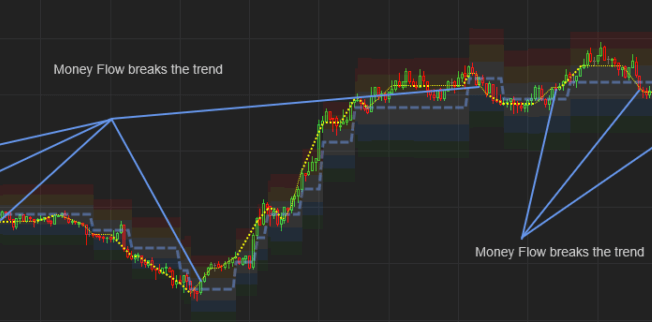
Money Flow – Trend Changes
Armed with a low-noise mean and signal line we are much better equipped to deal with trend changes. Since we don’t have so much noise and we know that our mean is fast adapting and representative of the the smart money, trend changes becomes far easier to spot, faster and with significantly less whipsaw.
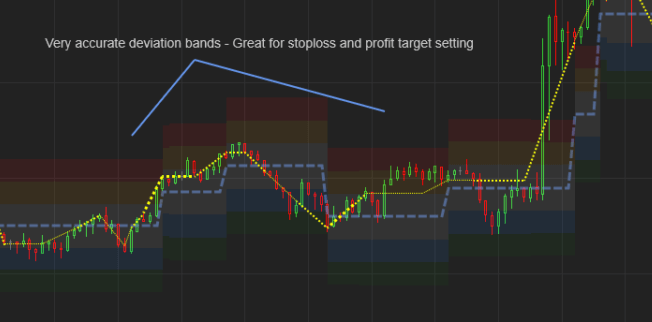
Money Flow – Deviation Bands
We also now have a better framework to calculate the volatility and represent it as bands above and below the mean. Much the same as Bollinger Bands would except more accurately and stable. These bands also help us set great Profit Target and stoplosses.
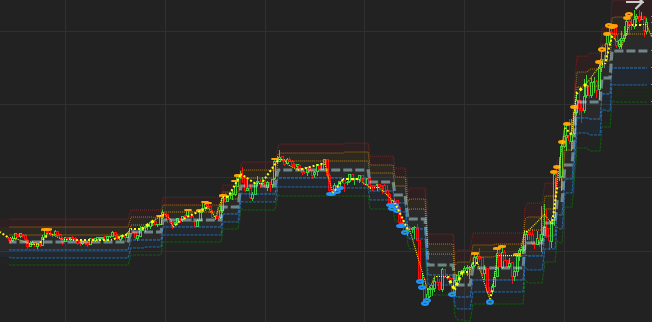
Money Flow – Signals
The Signals (Orange and Blue) Ellipses are plotted to show when the market moves in to an “extreme” place. Most often these levels present us with very good reversion opportunities. However when these levels are broken the market gains momentum and tends to move significantly further in its current direction.
Settings
You can customize this indi to your liking by selecting which plots to display and how large/bold etc. to display them. Please see the images below.


Imagine the market as a bustling street with everyone shouting at once. It’s tough to know who’s saying what. That’s where our secret tools – volume profiling and volatility measures – come in. The Yellow plot shows us where the smart folks are moving, like a treasure map for good decisions. This helps us figure out other important stuff, like the average and how much prices bounce around. Plus, the Blue-Gray plot is like a quick-change artist, adapting faster and better than a normal average. It shows us where prices like to come back to. With these tools, we’re like market detectives, finding the real clues and making the market a little less noisy and a lot more understandable.