Q-Bars, a NinjaTrader Indicator, combines all of the great features of our Heat and Smart Bars indicators.

Smart Bars analyses the interest ( Volume and other variables) to show us areas of support and resistance as well as areas of No interest. These are levels where the interest dries up, Kind of the calm before the storm. Heat is mostly focused on measuring the Momentum and Trend variables. Showing us how strong or weak these variables are.
We have also added our Power Wicks indicator to the mix. This indicator looks at the delta of buying and selling pressure and the shifts therein.
Combining these indicators allow us to get the right information regarding the Smart Money Volume Flow , The Momentum , High Interest and No interest Levels , Trend strength , Momentum , Delta and more. When we put it all together we get some really good trading signals.
The Market tends to move between areas of interest and No interest, Momentum or Trend, and then areas of Support and Resistance. Absorption and Distribution. Momentum and Reversion.
Multi Time-Frame
We get this information for every bar but we also look at this information at larger scales. We use the info gathered intra-bar to define trends and then measure this information on a larger “trend scale”
The information that we get form individual bars give us the information at a Micro scale. Then we add these up in individual trends to give us information about the Macro scale.
4 Bar Types
We define 4 unique bar types to explain these variables:
- Volume Bars (High Interest Bars)
- No Interest Bars
- Momentum Bars
- Balance Bars
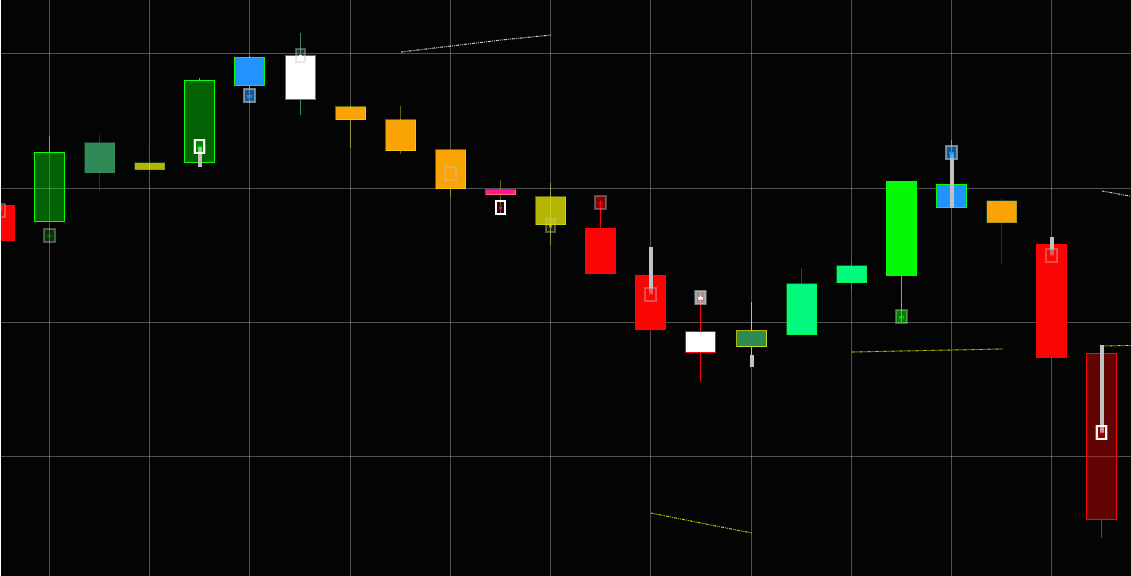
We then assign colors for all the bars in between according to their “heat” or their significance in terms of all the variable that we are interested in. These colors range from light colors to darker colors showing how significant these bars are.
![]()
Let’s take a closer look at them all.
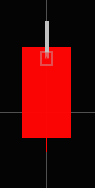
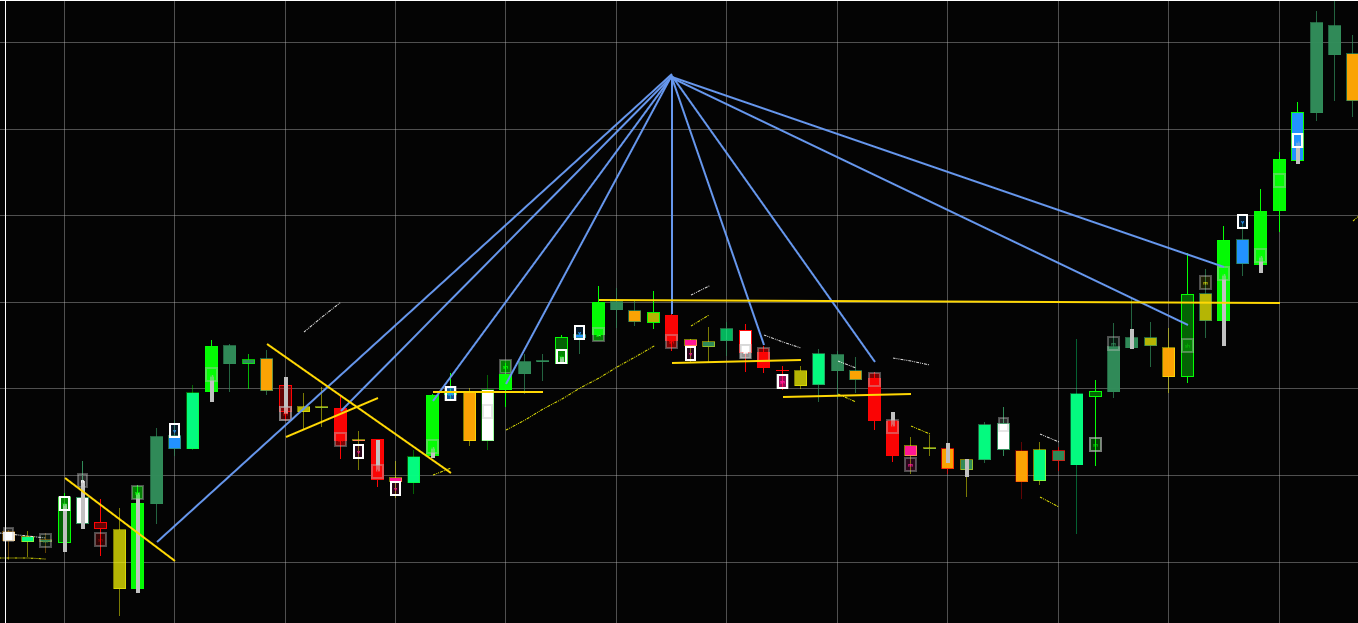
1. Volume Bars - High Interest
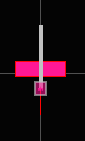
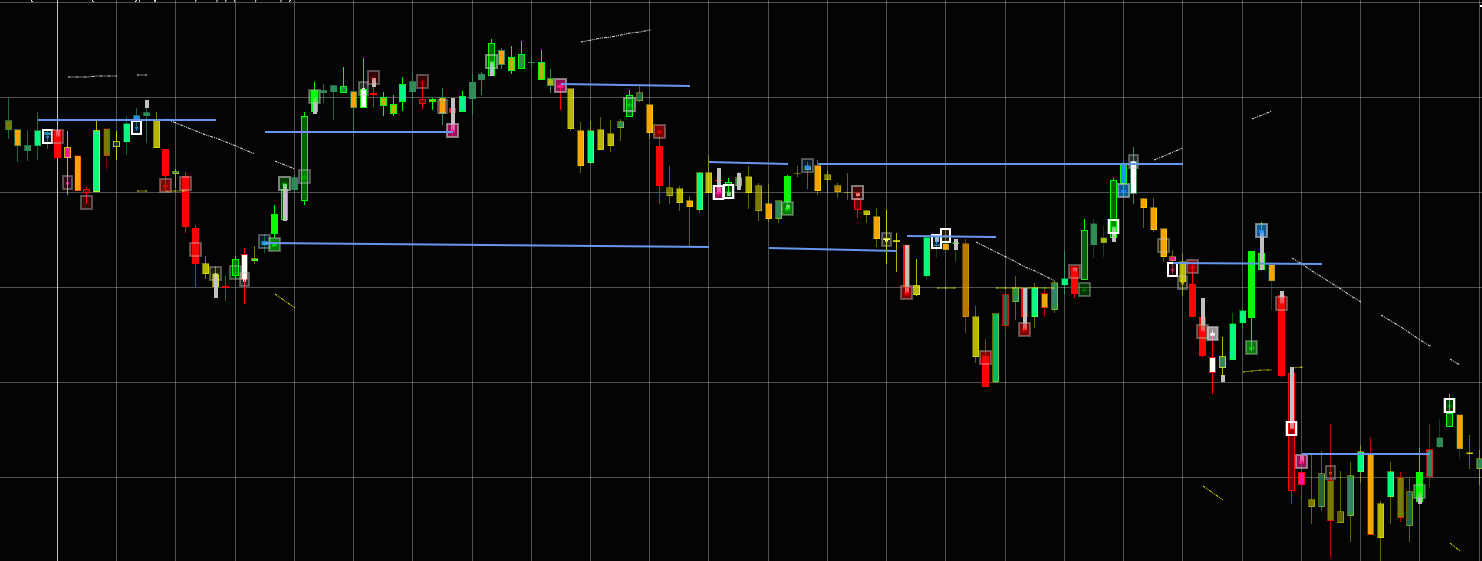
In the image above we have connected some blue horizontal lines to show how well these Volume Bars explain past and future support and resistance levels. Pivots are often formed after these bars appear. These bars also appear at significant past support and resistance levels as well as other areas of interest such as trendline levels when the market trades at these levels. The intra-bar SR level that we show with the white square plotted aims to pin-point the exact level where the support and resistance levels are.
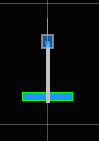
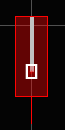
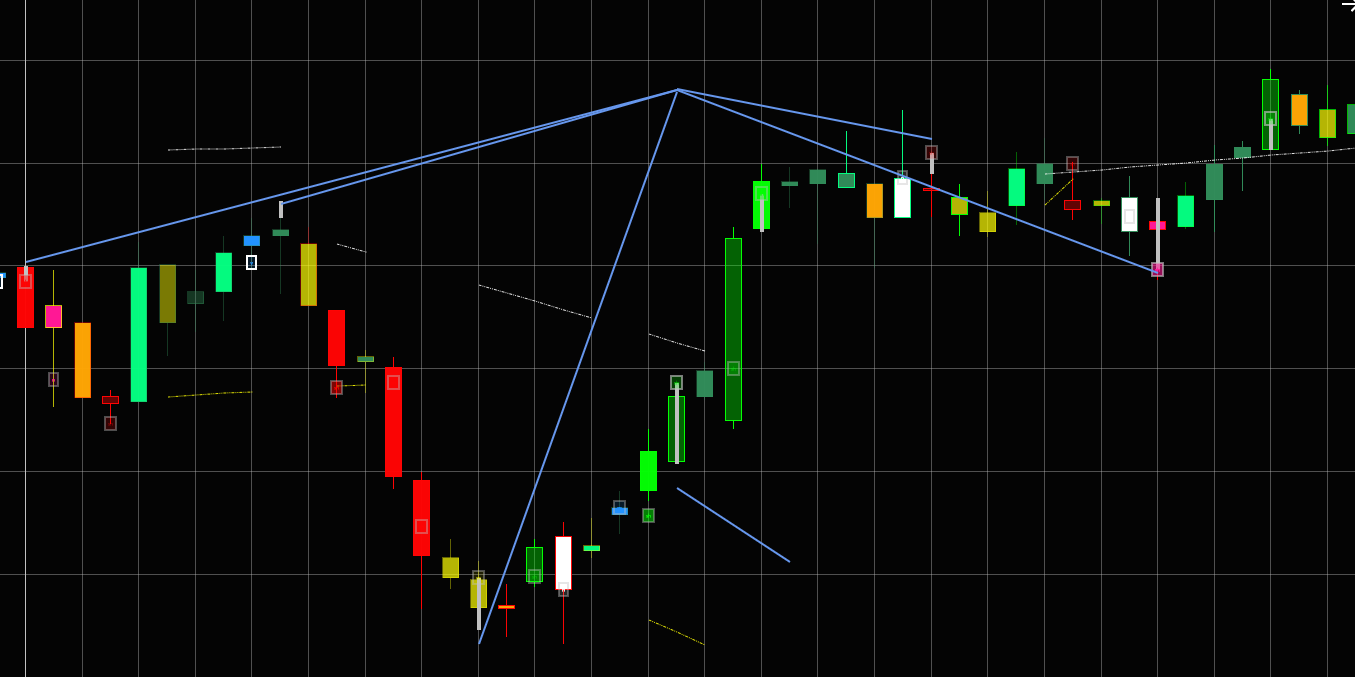
2. No Interest Bars
![]()
These bars plot when there is very little interest in terms of Volume and other Variables in the current bar. These bars are especially useful when there was significant activity before the bar appears. It shows a shift in market behavior, If there was significant buying before the bar, then the bar shows that the buying probably dried up.
3. Momentum Bars
We call these Brightest Red and Lime bars, Super Heat Bars. These bars show Super Momentum in the market. The Smart Money Volume must accompany the Momentum. These bars are most helpful when the market breaks out above or below significant levels, Like trendlines or support and resistance levels. They help a lot with confirming these breaks.
4. Buy / Sell Balance - Delta
We measure the buying and selling interest inside each bar and look for significant values and changes therein. This is very helpful to show changes in the behavior of buyers and sellers. This is shown by drawing wicks from the High or Low that extends to intra bar support or resistance.
We differentiate between fast, medium and slow trends.
Fast Trend:
This is the that is determined by the short term shifts in the money flow. The market is quite noisy at this frequency but this trend helps determine entries faster.
Medium Trend:
This is when the market gains some momentum (usually). We define it as when the market breaks the trend line or most recent pivot.
Slow Trend:
This is the super trend area, the market has broken out of its range or it making higher bottom Pivots or its making lower Upper Pivots.
Signals
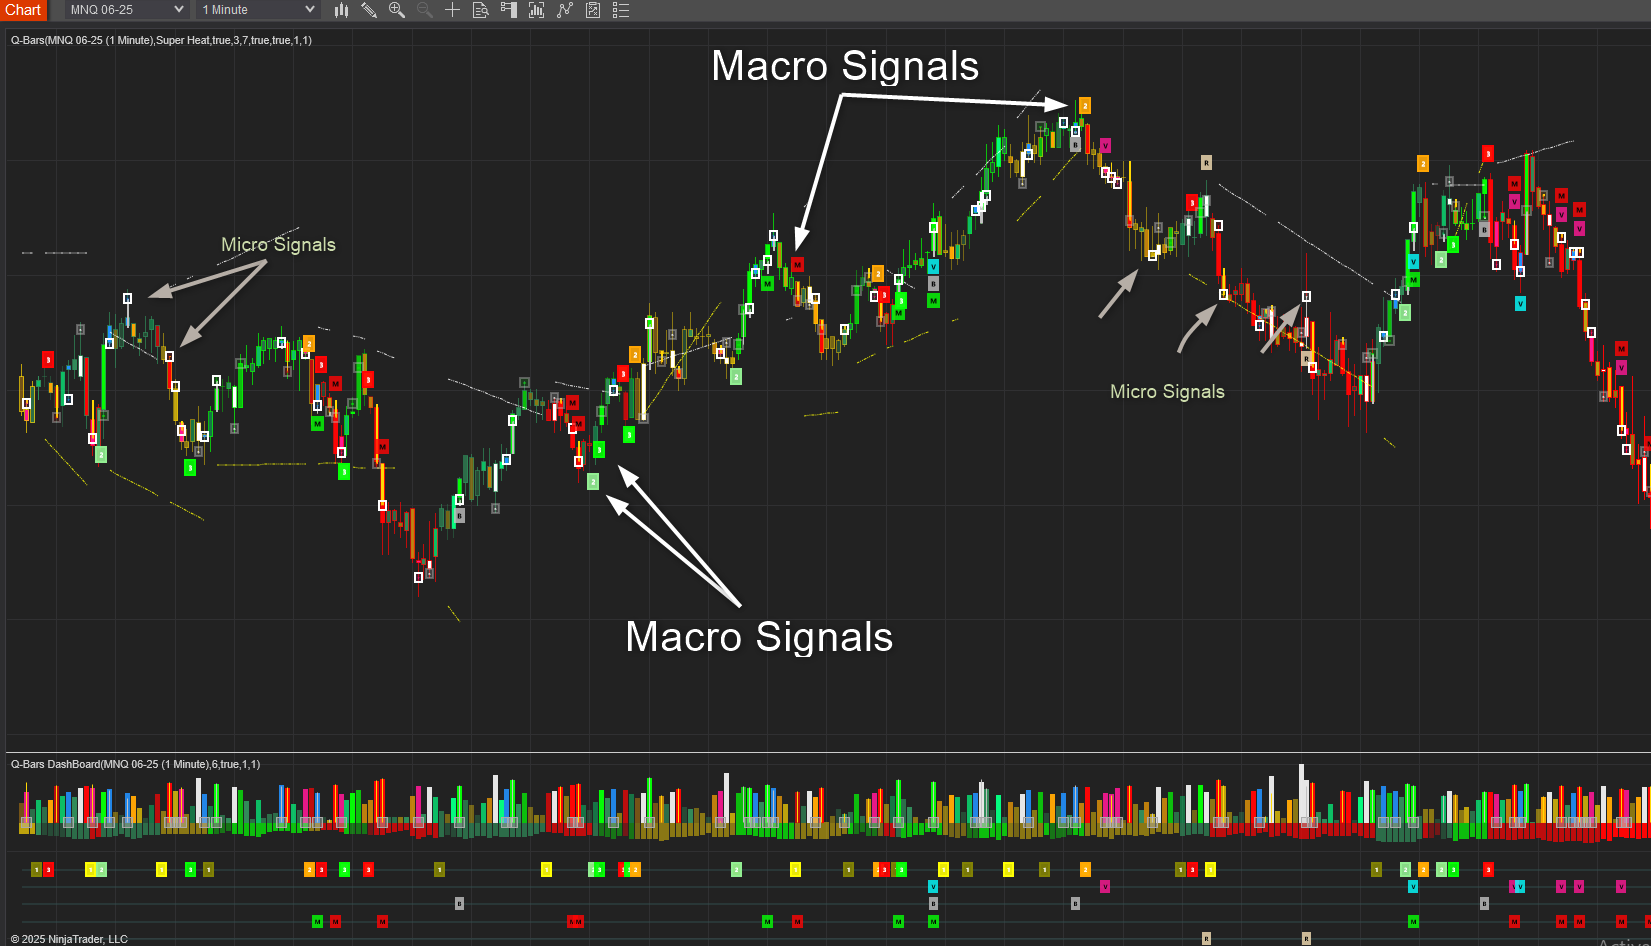
This indicator finds signals based on the Bar information as well as signals based on the Trend information. Micro and Macro Signals.
We have discussed the bars type above , namely Volume, Momentum, Balance and No – Interest.
Similar to how we measure these variables in every bar we also measure it in every trend to determine the same set of signals, Just based on the bigger picture.
These Bigger picture signals are great for entries, especially if you combine it with other indicators that show the context of the market, like support and resistance levels etc. The Micro signals are excellent for fine tuning entries , exits and scalping trades.
Q-Bars Dashboard
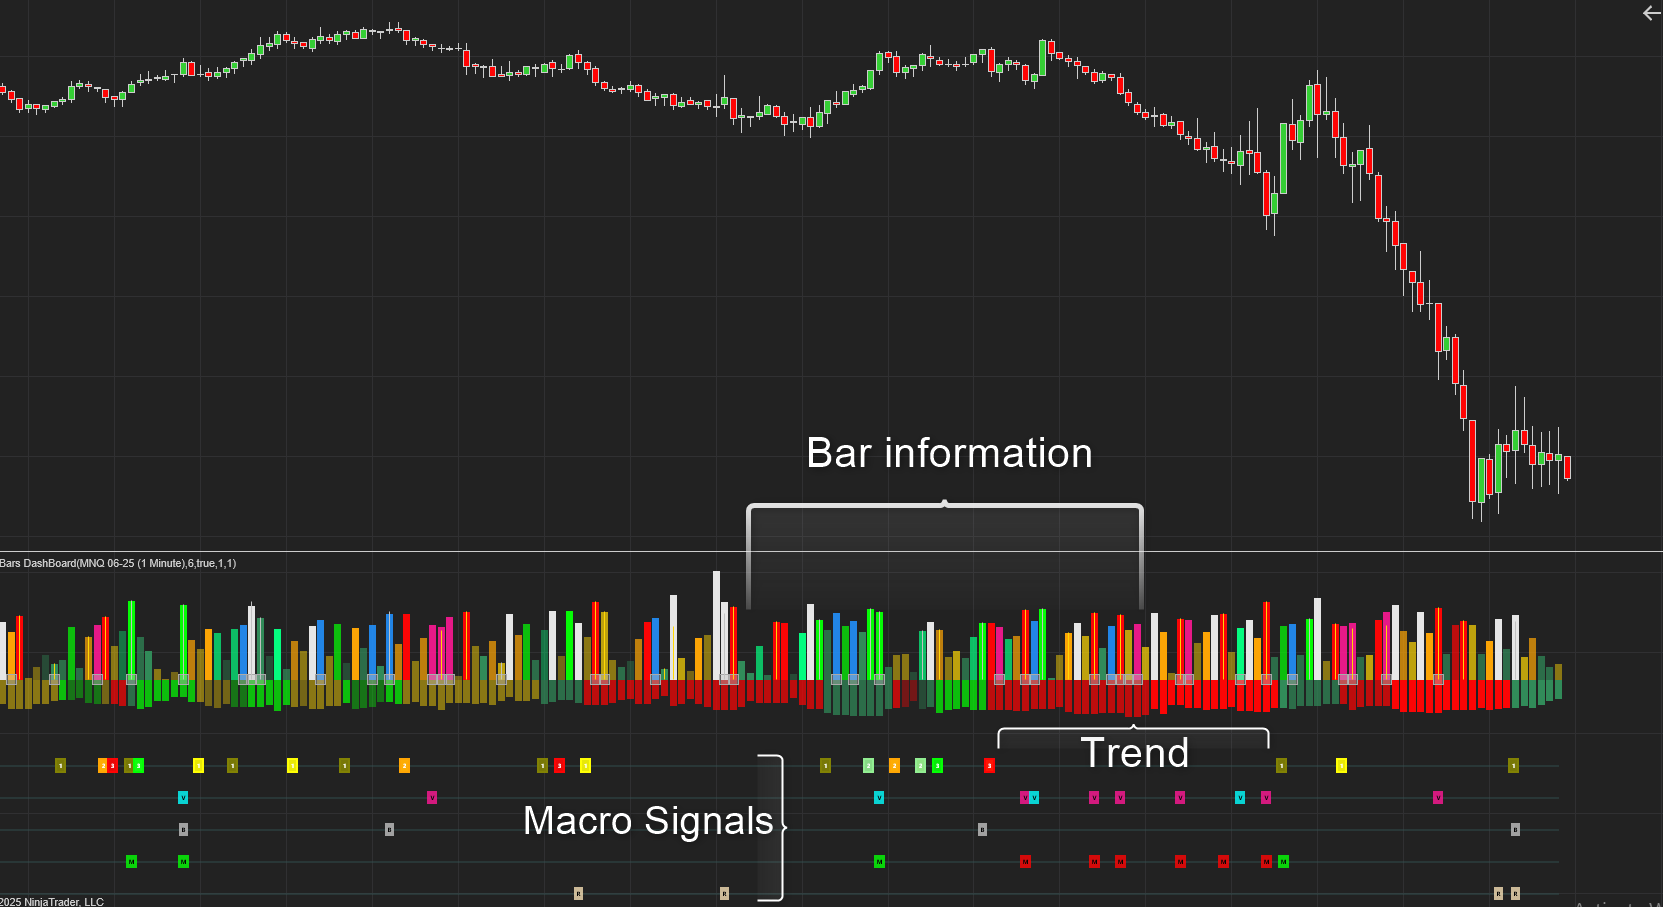
This indicator comes with a handy dashboard that displays the same info as the price chart. You can use either of them or both if you prefer.
Settings

Q-Bars in Action
-
“My journey in trading spanned 15 years, marked by persistent challenges in achieving consistent profitability. That trajectory shifted dramatically upon discovering Quaderr Indicators. Jaco, through his innovative Q Bar and Q Bar Dashboard, has truly been a ‘lifesaver,’ fundamentally altering my perspective on market analysis and dynamics.The Q Bar and Q Bar Dashboard are, in my experience, exceptionally potent tools. They form the core of a highly effective and robust trading system that I’ve found to perform remarkably well across diverse market environments. What truly sets these indicators apart is their unique ability to simplify complex market data, presenting it with a clarity that fosters actionable insights.Beyond the sophisticated design of the indicators themselves, Jaco’s commitment to user education is highly commendable. He has meticulously ensured that I possess a thorough and practical understanding of how to leverage his tools effectively. This focus on clear instruction and the intuitive craftsmanship embedded in each indicator speak volumes about his dedication to empowering traders.I am immensely thankful and grateful to Jaco for generously sharing his profound knowledge and invaluable tools. For any individual aspiring to become a professional trader, I unequivocally recommend Quaderr Indicators as a truly special and transformative resource.”