Support and Resistance (SR) are valuable tools in trading, not all SR levels are created equal nor are they even predictive.
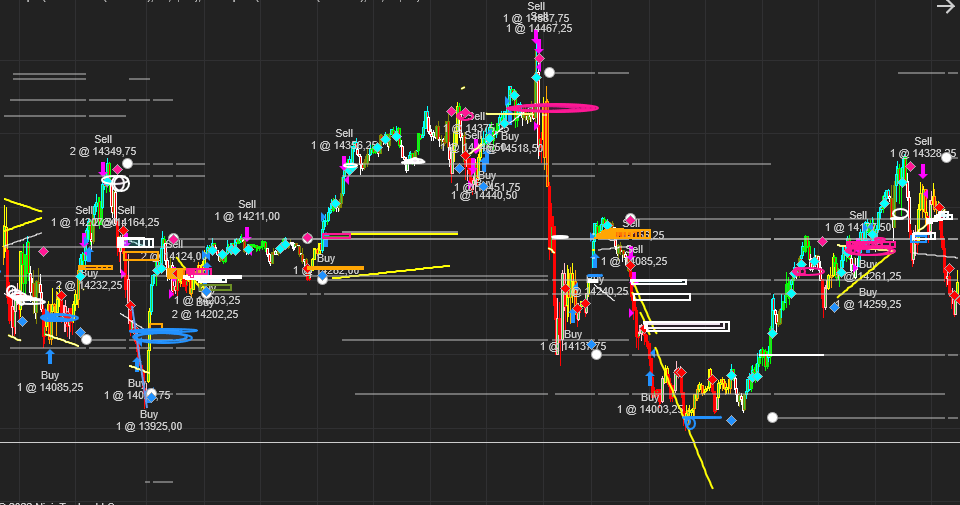
Q-Scalper in Action
What this means:
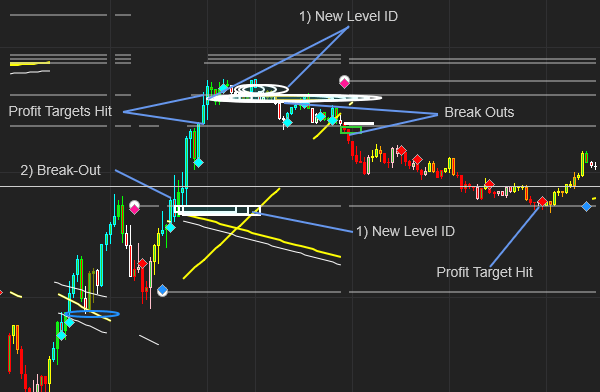
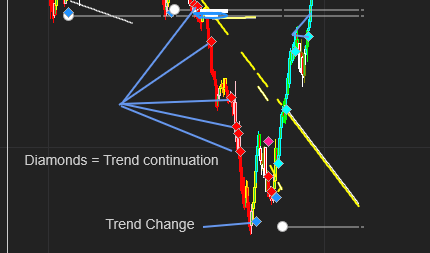
Q-Scalper – Diamonds (Momentum)
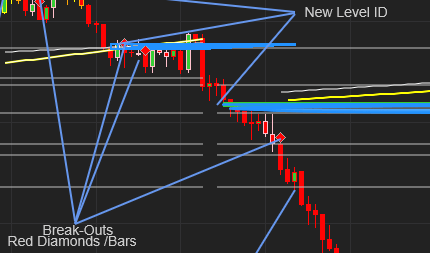
- Red and Blue Diamonds are drawn when the market has momentum.
- These Diamonds are excellent confirmation triggers for break-outs from these SR Ranges.
- These Momentum Diamonds are also indicators of an accelerating trend, ex: when the market moves above / below the last resistance / support level. The trend tends to continue when this occurs
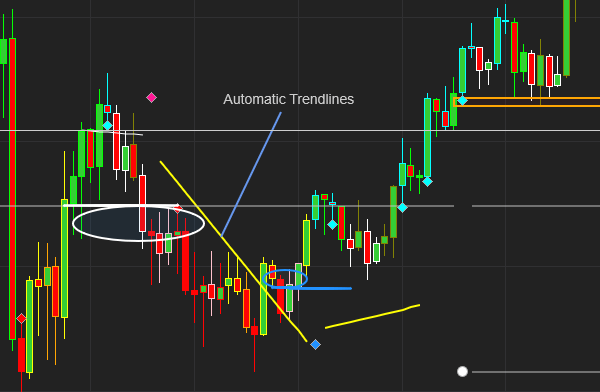
Q-Scalper – Trendlines
- The indicator dynamically finds the significant trendlines around the price.
- Breaks from these lines generally produce good trades.
- Look for a Diamond to appear around the trendline for confirmation of a break.
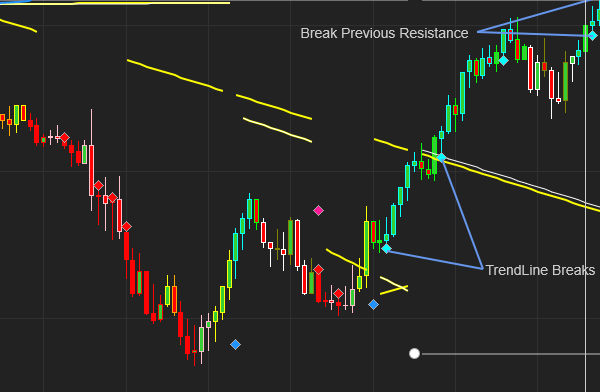
Q-Scalper – Bar Colors:
Bar Colors change depending on the current fast and slow trends:
- Blue – Strongest up trend
- Green – Medium strength up trend
- White – Low strength up trend
- Red – Strongest down trend
- Orange – Medium strength down trend
- Yellow – Weakest down trend
Q-Scalper – Settings:
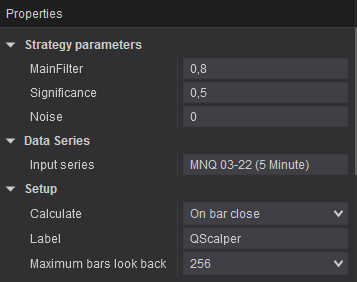
- MainFilter – This determines the size of and frequency of signals. Large values = fewer signals. Values between 0.2 and 2
- Significance – This determines how strong a level must be in order to qualify for trading. Values between 0.2 and 1
- Noise = this determines the width of the Rectangle to shade out the noise. Values between 0.2 and 0.5
- Rectangle Extension = When the level is identified , the rectangle starts plotting. This setting determines how many periods ahead it will extend the rectangle. Reduce clutter with this setting.
- SF = This setting determines how much of the past Levels are visible on the chart. 0 = nothing, 1 == all
- Draw Position Size = If this is ticked, the indicator will plot the risk based position size for the signal. The indicator calculates the desired position size based on your account size and risk settings. eg $100 000 account, risk = 0.05, This willing to risk $ 5000 per trade. Thus position Size will be X (22) contracts to be traded.
- You also have the option to turn the bar Color changes off.
- You can also select to display the diamonds or dots.
Q-Scalper – Alerts
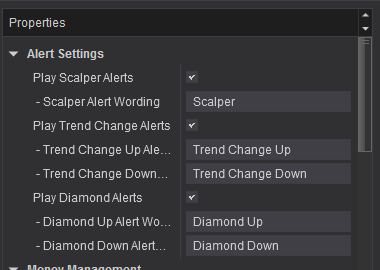
- We have added some very useful audio alerts to this indicator. The user can specify what the indicator must “Say” and it will.
- These alerts only trigger on Trend changes, Alert triangles and Diamonds.
Q-Scalper – Money Management
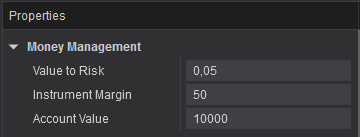
Value to Risk = The % of capital you are willing to risk per trade
Instrument Margin = The margin required for the instrument you are trading
Account Value = The value of your account or the value of the capital that you are allocating to this strategy
Draw Position Size = If this is ticked, the indicator will plot the risk based position size for the signal. The indicator calculates the desired position size based on your account size and risk settings. eg $100 000 account, risk = 0.05, This willing to risk $ 5000 per trade. Thus position Size will be X (52) contracts to be traded.
Happy Client: Q-Scalper
-
Q-Scalper is a remarkable toolset, with feature rich environment of several or more indicators and calculations. You receive awesome signal set-ups. With just a few easy controls one is able to configure it to be faster for aggressive scalps or even await a more established intraday trend for a longer ride on intraday swings. It is a very comprehensive intraday toolset. The loading of charts and running live real time are smooth. There’s no slowing down and responsiveness issues with NT8’s User interface – the programming and coding is top drawer. Quaderr’s support have been responsive and helpful to all my queries and I am looking forward to the release of an automated version.
This is a really efficient scalping indicator.
Profit Targets and stops are dynamic as you can use SR Levels to determine these. This is a Far better approach than simply using and x ticks profit target and y ticks stoploss.
It also generates trades frequently without over trading.
You can easily determine your risk reward per trade buy simply looking at the previous SR levels and comparing this to your entry level
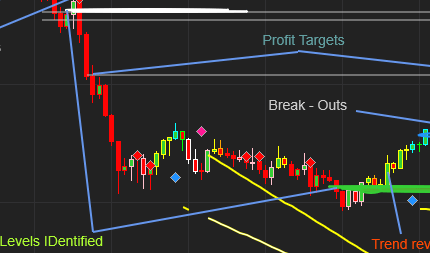
Tips on How to Trade Q-Scalper:
We like to enter trades when the market breaks above/ below the level given by the indicator. We then look for possible profit target levels based on the previous support and resistance levels (white horizontal lines). You can generally gauge how big a move can be based on previous recent moves. So in other words determine the potential size of the move and then find a support or resistance level at that distance. This should be a good profit target level. We like to use the trailing stoploss curve to trail our stoplosses.
The market tends to be noisy around a break-out level. Often the market will break the level and pull back towards the level. It’s safer to wait for the market to pull back towards the level and enter your trade close to the level. Many times the market doesn’t pull back so if you wait for a pull back you will miss the trade. An idea might be to enter part of your position when the market breaks out and enter the other portion when it pulls back.
It’s also wise to only start trailing your stoploss after the market has pulled back or the market has moved significantly in your favor. Your initial stoploss could be placed at a decent support/ resistance level above or below your entry level.
-
If you are looking for the indicator that encompasses multiple solutions the Q-Scalper is the perfect indicator. It was made by a developer who is also a trader and he knows what happens every day on the financial markets.