Introduction to Smart Bars
Every bar contains information. We miss a lot of valuable information because we filter these bars by time, variance or some other method. There are probably no perfect way to build our bars so the best solution would be to allow our bars to provide us with all the valuable information that we need in a neat, compact and informative manner. That is precisely what our Smart Bars indicator does.
Q-Smart Bars in Action
An Information shortage
Bars tells us the Open, High, Low and Close only. This is important information but we need to include other more valuable information like Volume, Trend factors, Momentum , Volume imbalances, price – volume imbalances and intra-bar support – resistance as well.
In essence the market moves between periods of buying and selling, yes, but also between periods of momentum (trend) and periods of reversion (reversals/ support / resistance) and then back again to momentum…
We have created this Ninjatrader indicator to address this information shortage by looking inside every bar, analyzing the Price/Volume metrics and defining each bar in terms of Volume, Trend factors, Momentum , Volume imbalances, price – volume imbalances and intra-bar support – resistance.
With this information we are far better equipped to understand the micro picture as well as the big picture in the market.
It helps us make better decisions as to when and where to enter and exit. To confirm break-outs, reversals and trend continuations.
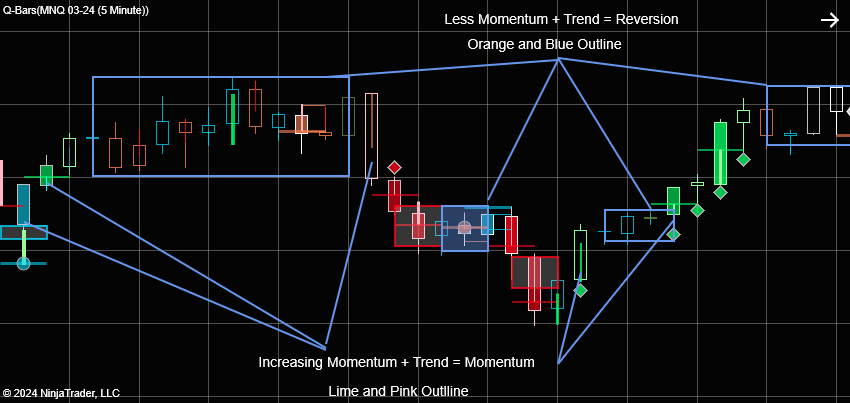
Barring some slight deviations, we work with a basic color scheme of Red and Lime for Momentum, Orange and Blue for Reversion. This helps visualize the flow of Rev and Mom over time.
1. Trend, Momentum and Volatility (Outline Colors)
This indie measures and compares the trend, momentum and volatility to previous bars and determines whether it is significant or not.
Smart Bars Outline Color:
- The outline color of the bars changes to Pink (Selling) and Lime (Buying) when there was a significant increase in the trend, momentum and volatility. ( Momentum)
- When the opposite occurs and the trend, momentum and volatility decreases the bar outline color changes to Blue (Buying) and Orange (Selling). (Reversion)
What it means for trading:
- This really helps to see the flow in the market in terms of accumulation and distribution. The shifts in color adds invaluable information to how we experience the market.
- We can clearly see how the market shifts from reversion to momentum and back.
- Long periods of reversion (Blue and Orange) is often followed by a break-out of this range and leads to momentum (Pink and Lime). The longer these consolidation periods the better.
- We can also clearly see areas of a pause in the trend (momentum) followed by a continuation of the same trend .
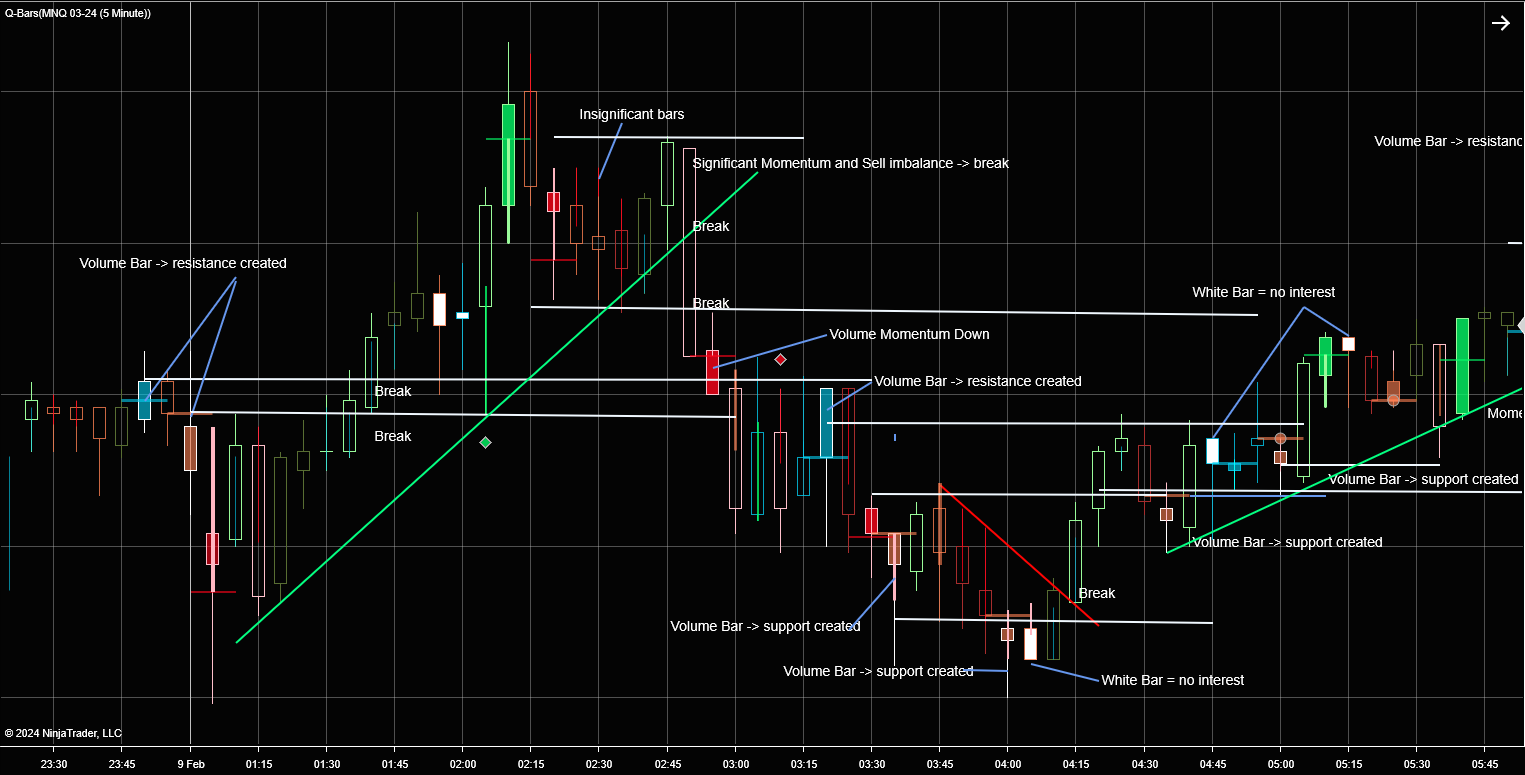
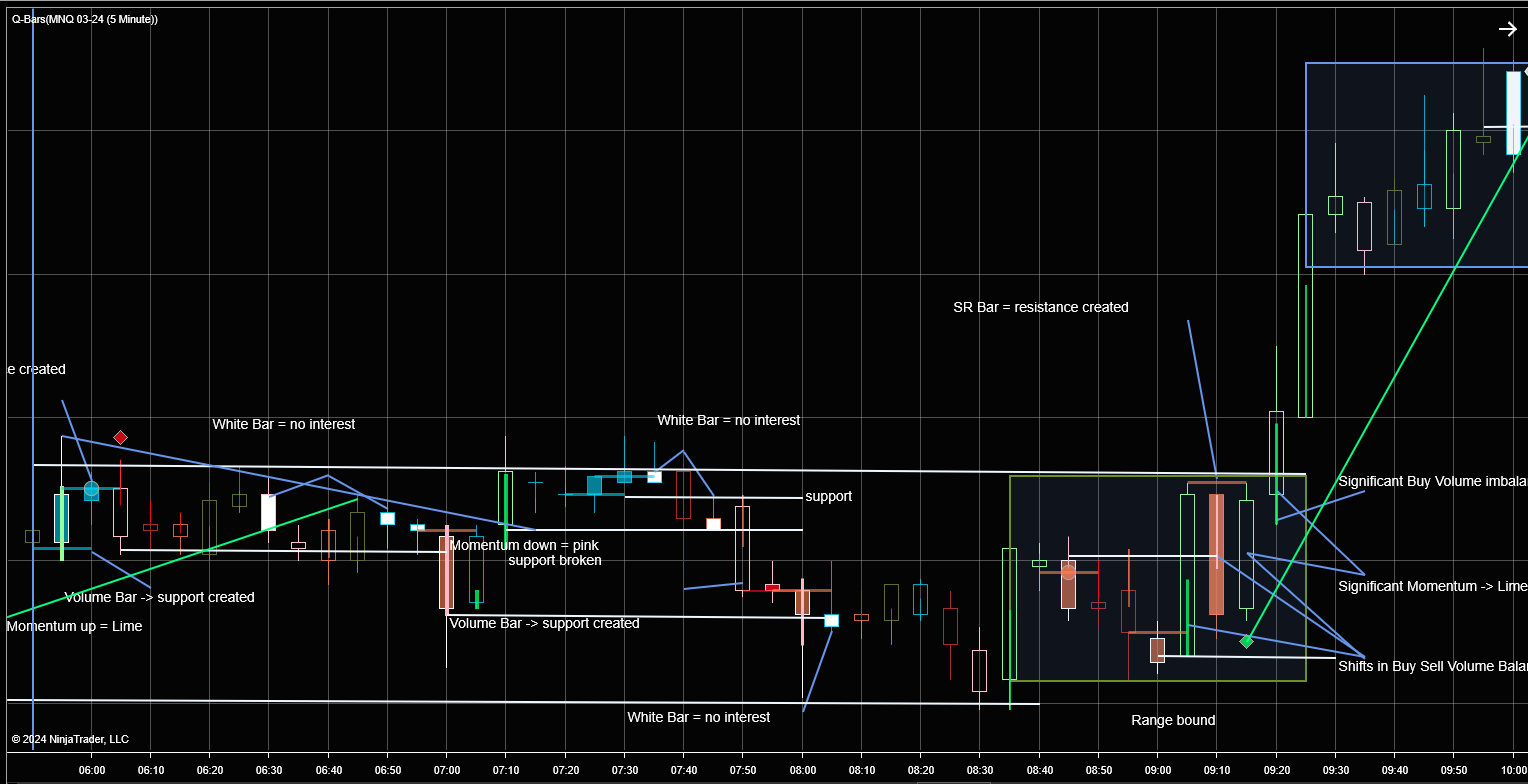
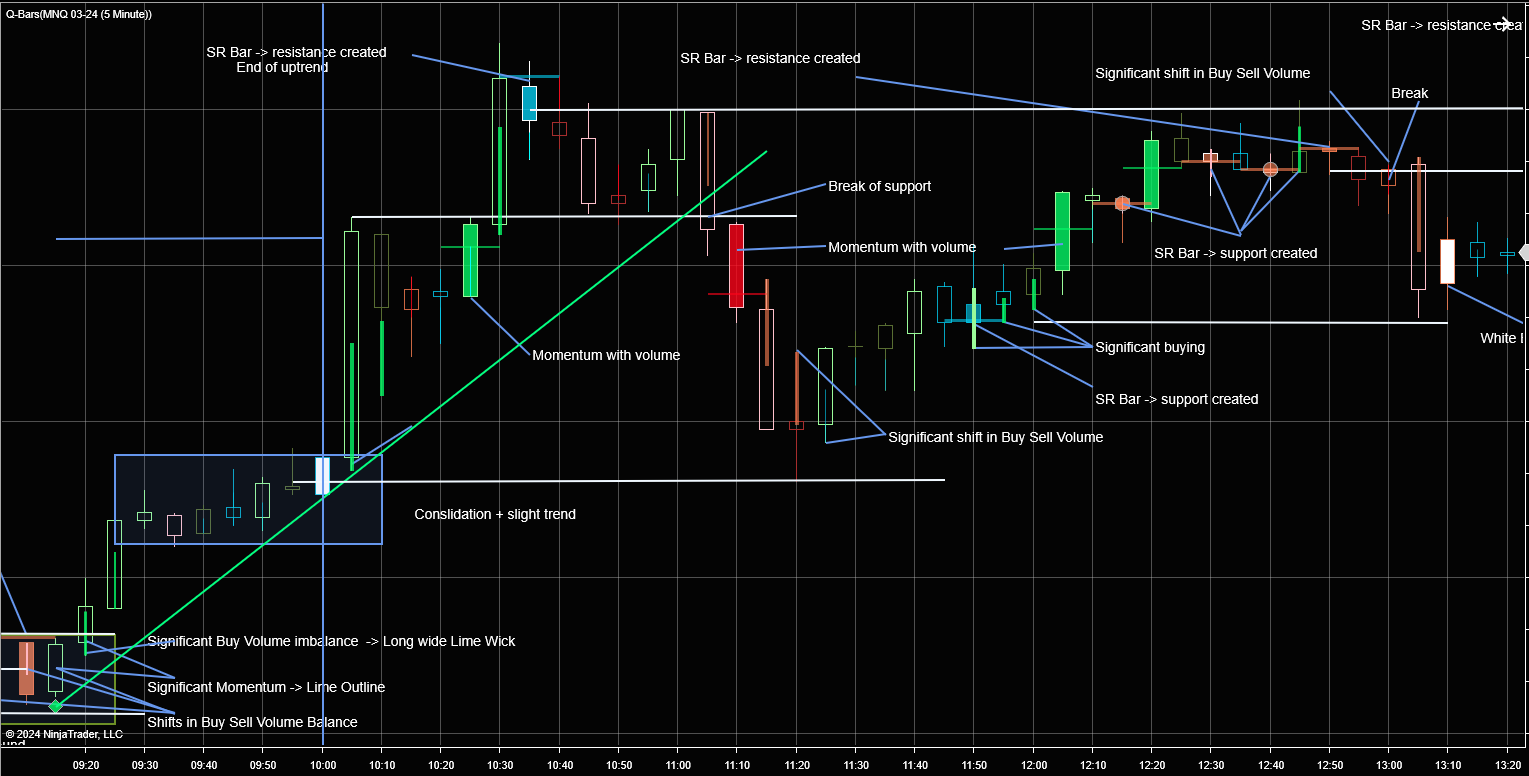
2. Volume (Smart Bars Fill Color)
This indicator identifies the smart money volume in each bar, compares it to previous bars and determines the following:
- The bar volume’s significance.
- Filters the Smart Money buying from the rest.
- Determines if the volume traded was momentum volume which could lead to a continuation of the trend or reversion volume.
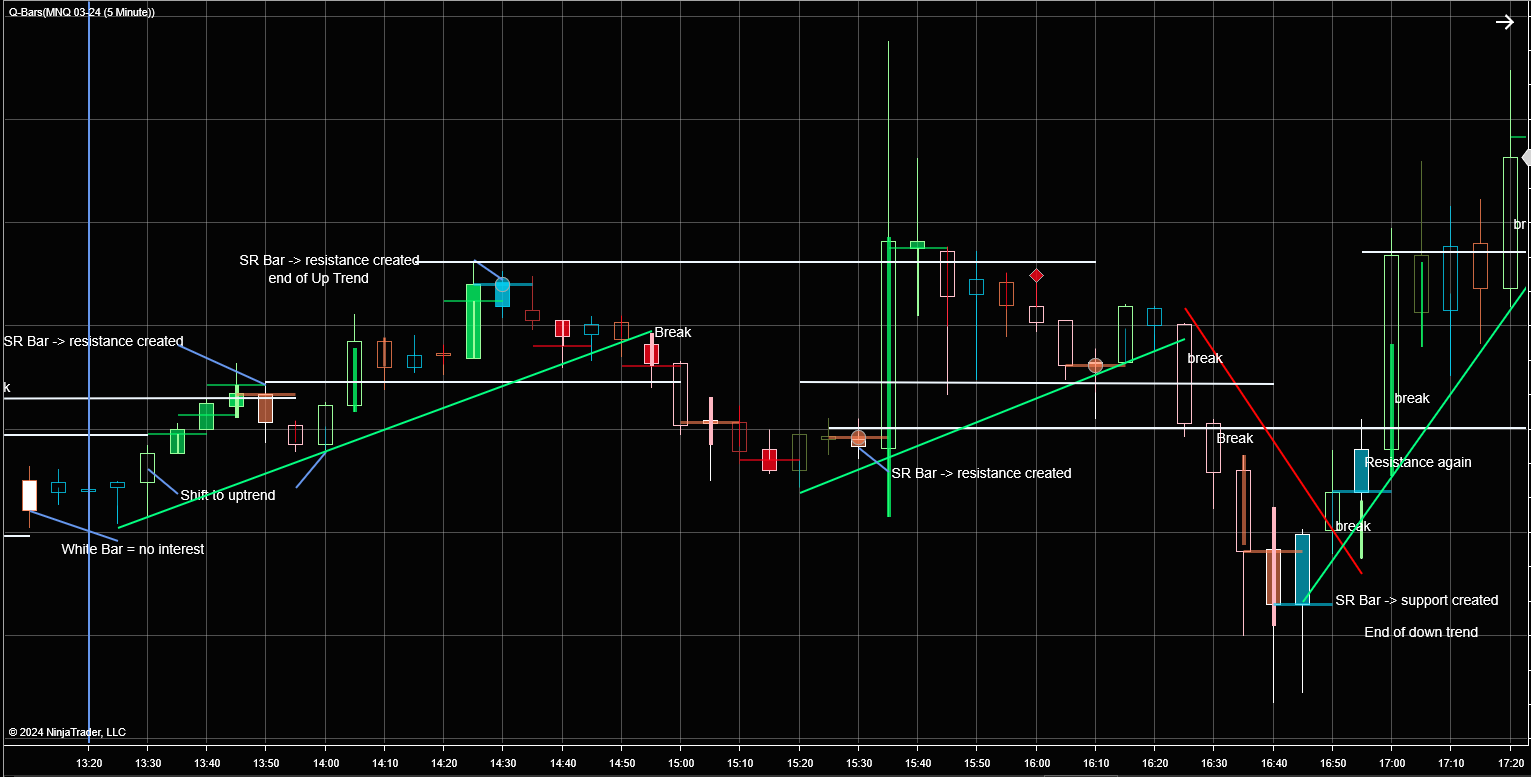
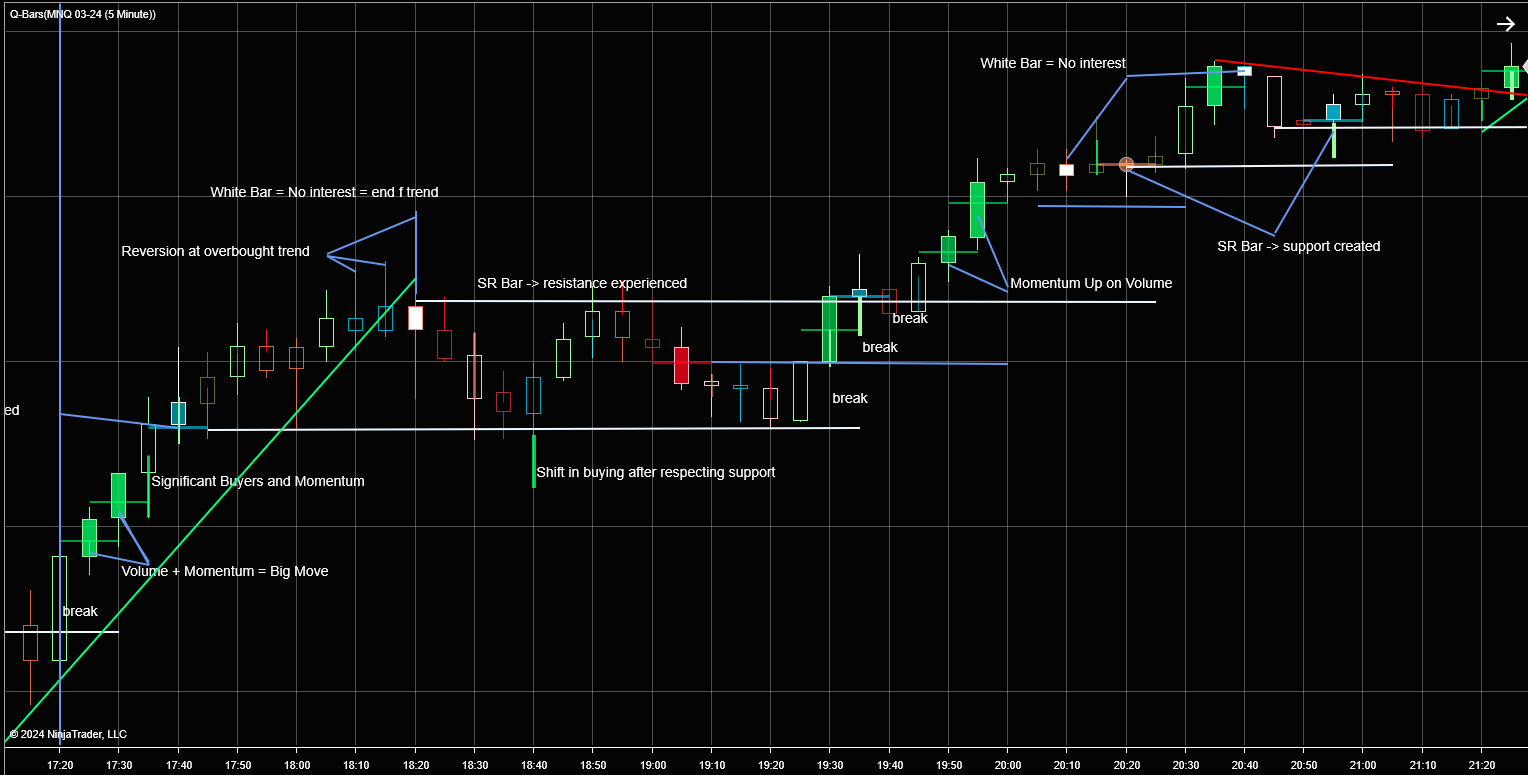
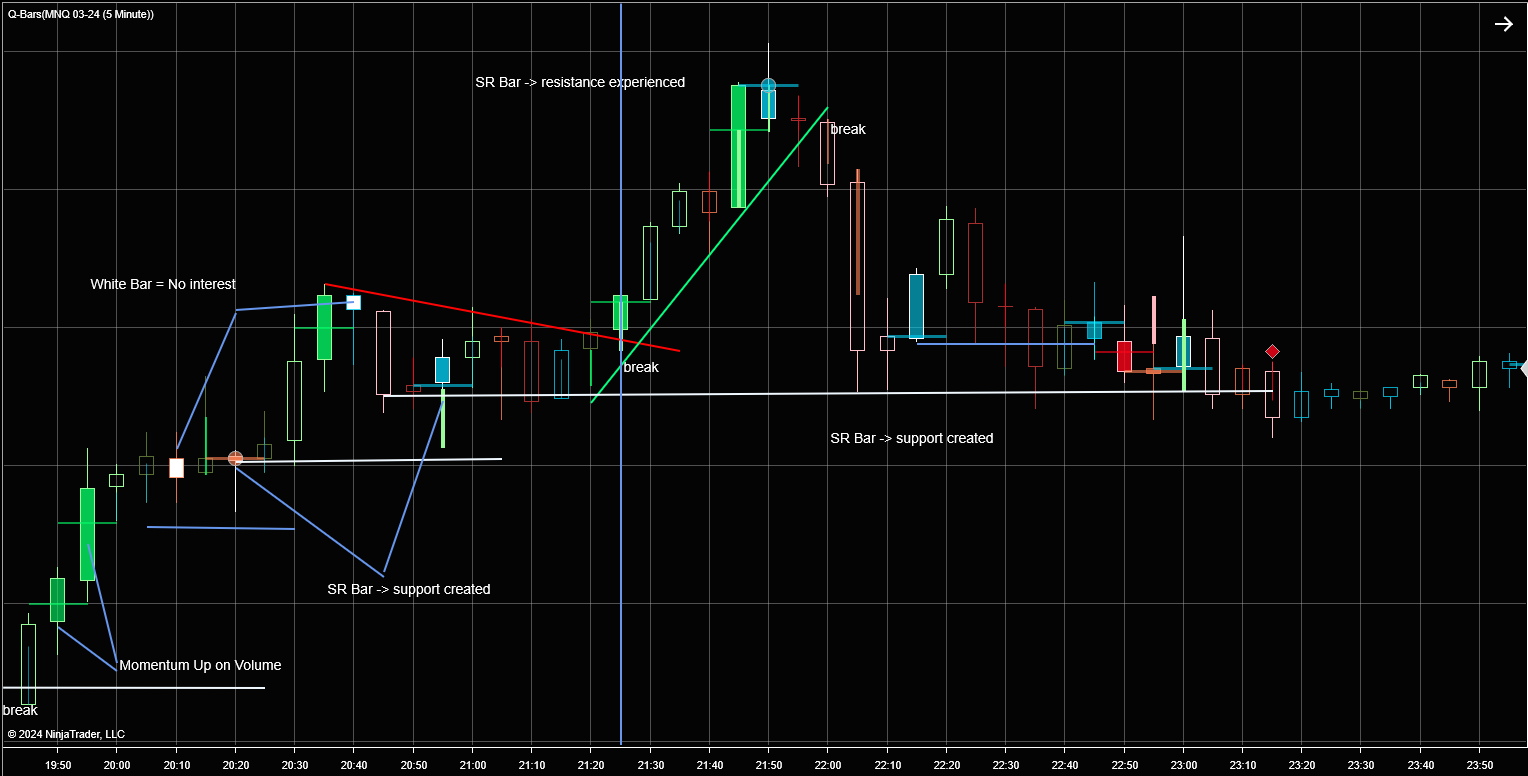
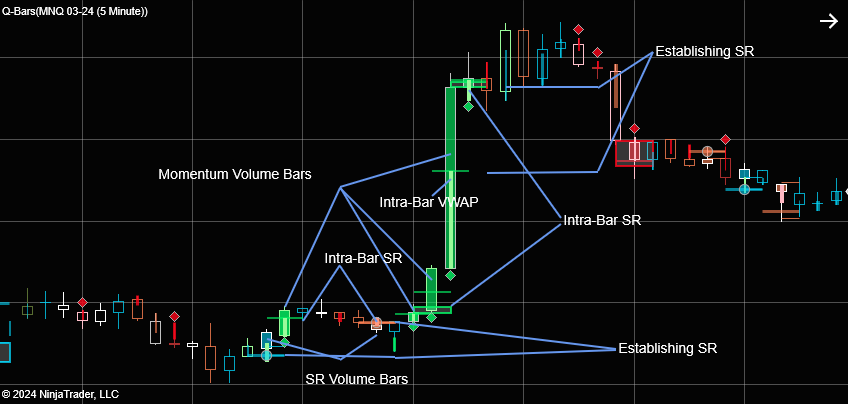
- This reversion volume creates areas of support and resistance that that very often repeats itself in the future.
- It also uses this volume to determine the intra-bar support and resistance levels.
- It calculates and plots the intra-bar VWAP.
Bars are filled with Red or Green (Up) and Blue or Orange (Down) when significant smart money volume was traded in the bar.
Bar Colors:
- Green and Red when the volume traded was accompanied by or generated momentum.
- Blue and Orange when the volume traded experienced or created support or resistance.
What it means for trading;
- Support and resistances are often created by volume and Break-outs are usually preceded by or accompanied by significant increases in volume and momentum making these bars are very informative.
- It shows Momentum vs. Reversion.
- Volume SR bars creates levels that is useful in setting profit targets, stops and more.
3. Volume – Buying / Selling Balance (Wick color)
Q Smart Bars also measures the balance between buying volume and selling volume intra-bar by changing the colors of the wicks.
These im-balances can agree with the trend and momentum or not. Momentum or Reversion.
These values are also tested for significance and compared to previous bars.
Wick Colors:
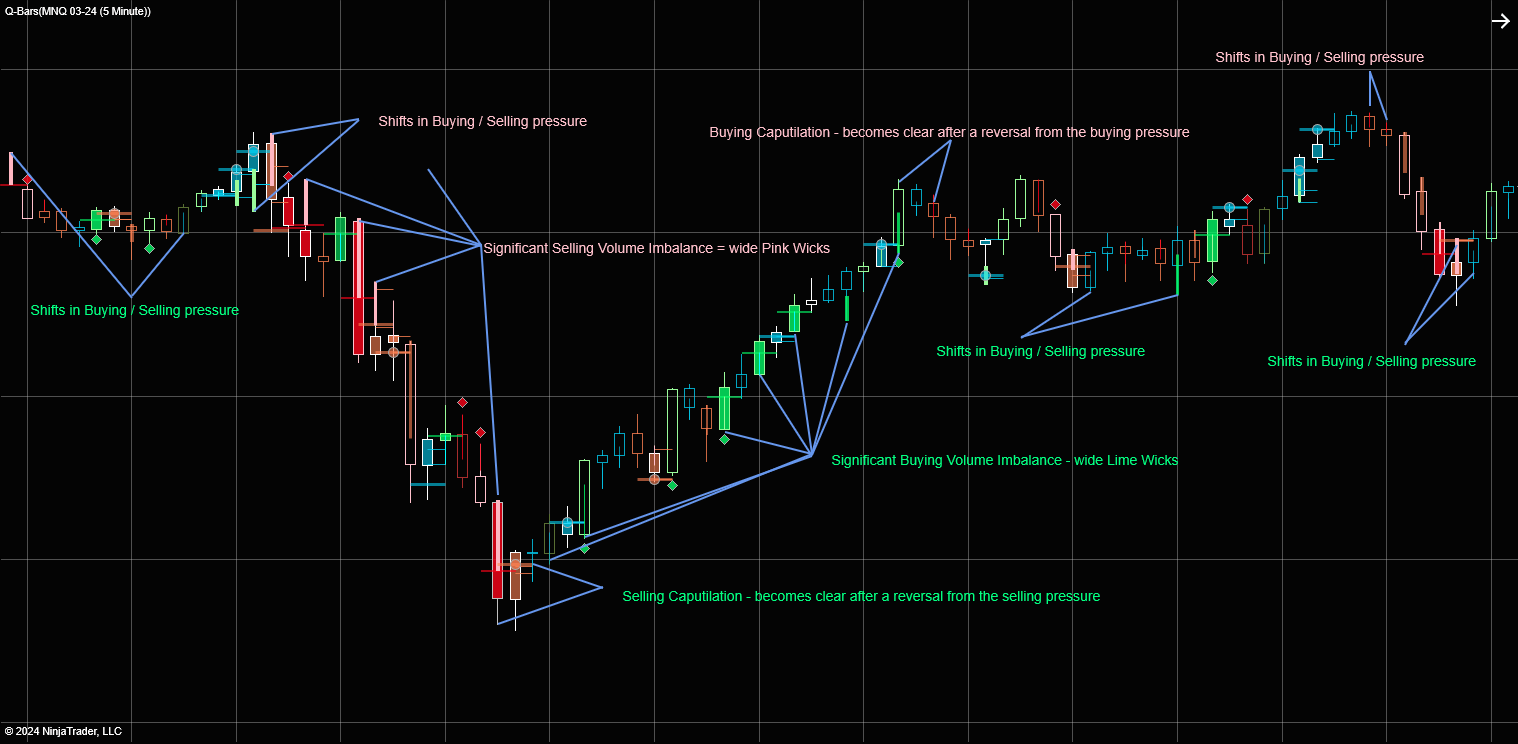
- The wider and longer the wick is the more significant the Buy/Sell imbalance is.
- Lime wicks for Upward momentum buying – The trend is up and the buying outpaced the selling.
- Pink wicks for downward momentum selling – The trend is down and the selling outpaced the buying.
- Blue wicks for upward reversion buying – The trend was up but the selling outpaced the buying.
- Orange wicks for downward reversion selling – The trend was down but the buying outpaced the selling.
What it means for trading:
- Shifts in Buying/Selling pressure – The wicks shows us clear shifts. These shifts are more significant after longer periods of prolonged buying and selling.
- Significant B/S imbalances – These imbalances clearly shows us continued or increased momentum in a trend ( Pink and Lime) .
- They also show us when the volume imbalance indicates reversion in a trend that may lead to a reversal in the trend ( Blue and Orange)
- Confirmation of break – outs and reversals – These imbalances and shifts helps a lot with confirming a break-out or a reversal point.
- They also shows us when a trend is getting exhausted.
- Momentum vs. Reversion.
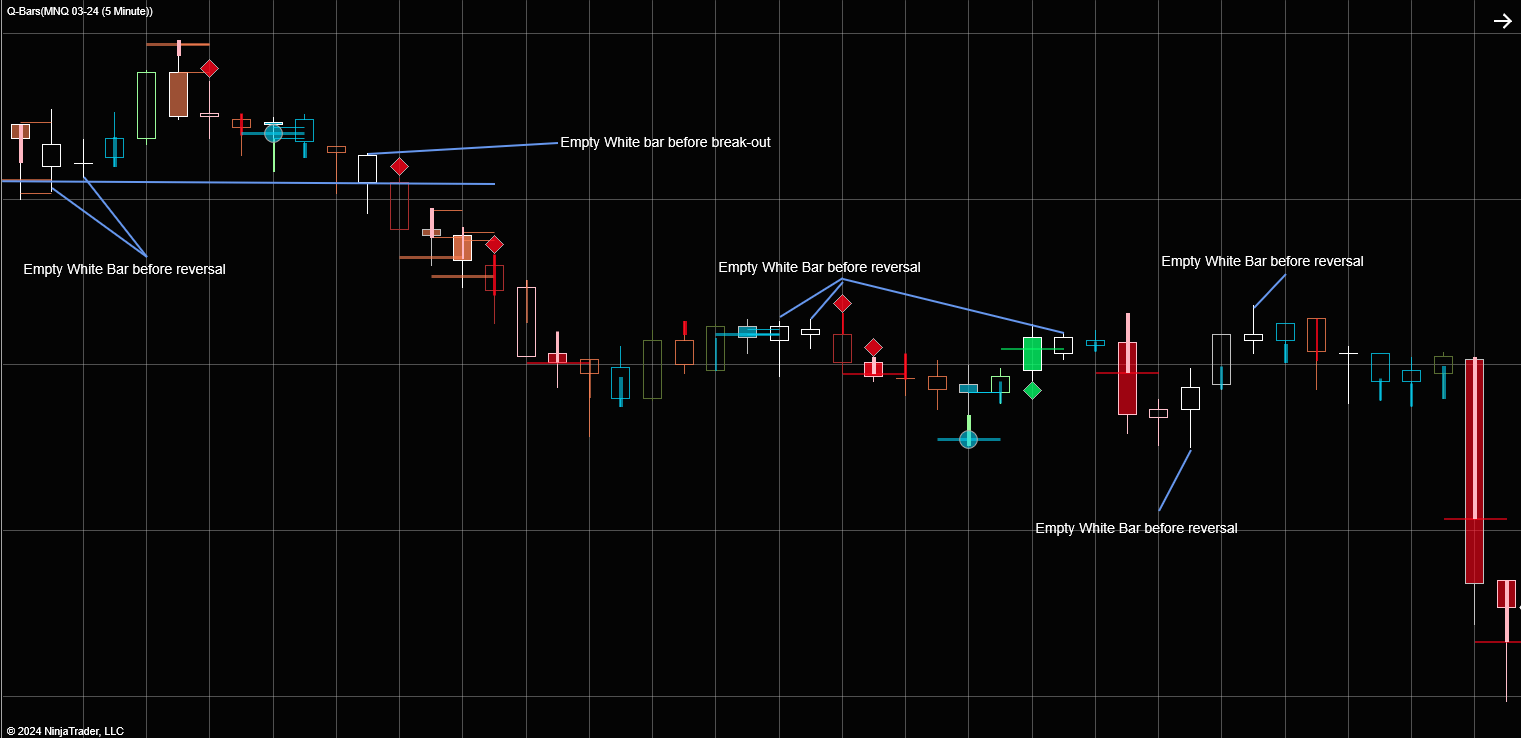
4. No Interest – Empty White Bars or White filled Bars
Another opposite in the markets is the opposite of significance which is complete insignificance. The market sways between metrics of significance and that of insignificance. Like Yin and Yang.
What it means for trading:
- The periods of insignificance are usually followed by periods of significance. This can bee seen as the “quite before the storm”.
- Reversals are very likely after these bars and often break-outs occur as well as there is no support or resistance at the level left. It shows that whatever preceded it (selling or buying) is now over.
- During times of low Volume and trend etc. These bars are the bars which are more likely to give us good information.