We have developed this indicator to take care of all our stoploss needs.
We wanted to find a definitive solution that is robust and effective. Using a simple X ticks or Y ATRs as a stoploss and trailing stoploss simply does not “cut” it. SL and TSL should adapt to the volatility , noise, trend and price action of the current market conditions. It should be slow in choppy conditions, fast in trending and very fast in “super trend” conditions. Learn how our Q-TSL indicator works.
Q-TSL Indicator in Action
Description
- The indicator finds and plots the TSL levels above and below the current price. (Blue plot)
- As the trend evolves it adjusts upwards / downwards.
- If the TSL level is breached, it adjusts itself to the new TSL level. This is assumed to be a trend change if the breach is against the current trend. (Red and Green plots)


How to use it
The TSL updates with every tick so the bands will adjust with it. When you enter a trade, you set your initial stoploss at the TSL level. As the market moves in your favor, simply adjust your trailing stoploss upwards (Longs) or downwards (Shorts) with the TSL indicator.
Real Market Trading examples


The images above and below illustrates how we have applied it to an automated strategy. The indicator only plots the TSL whilst we are in a trade.


The indicator fares very well with adjusting to market conditions. It adjusts quickly in trending markets and slows down effectively when the market becomes choppy.

Comparison
We have compared this indicator to many well-known and popular Trend and Trailing stoploss indicators. One of the major problems with Trend indicators is that in order to filter out the noise (whipsaw/ False signals) the slower the indicator becomes.
Every tick counts
If you can trade even just One bar sooner, without getting whipsawed, imagine the difference this will make to your trading results. It’s clear from the image below that Q-TSLi gives trend changes faster (Blue Lines) in most cases and with far less false (noise) and missed signals (Magenta Lines).

Audio Alerts
We have added audio alerts to this indicator. The alerts will speak what you need it to say when the TSL levels are breached.
More Features
All Plots are customizable
You can select which plots to show, Any, all or none.
Works well on all time frames and Instruments.
A full user manual is included in the download.
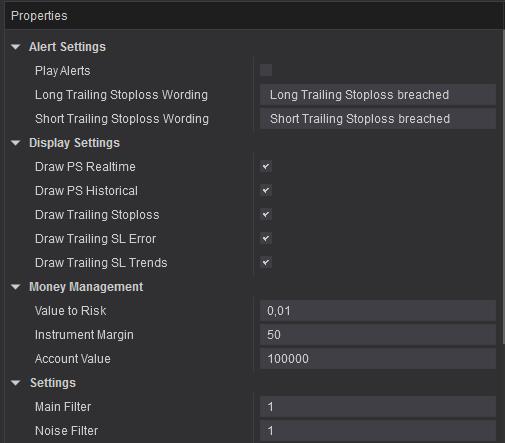
Customizable Plots


