Volume Bars – Introduction
Volume Bars asks the questions “What are the big players doing, how can I follow them and how do I not go against them?”
Q-Volume Bars is a Ninjatrader indicator that follows the “Smart Money” in the market.
It requires some complex mathematical models and smart algorithms to filter the smart money actions in to a user friendly and accurate indicator. We have found that it is not simply enough to Only model the volume and price but to filter and define the volume to find the Smart Money movements within the volume. We also know and saw that the market moves from periods of interest, no interest and back again. This we define well with Volume Bars. We have done the research and came up with the following…
Volume Bars – Break – Outs
We will get a lot of false break-outs if we don’t follow the volume / money. Volume Bars is a Must have to confirm break -outs. Please see some examples below.
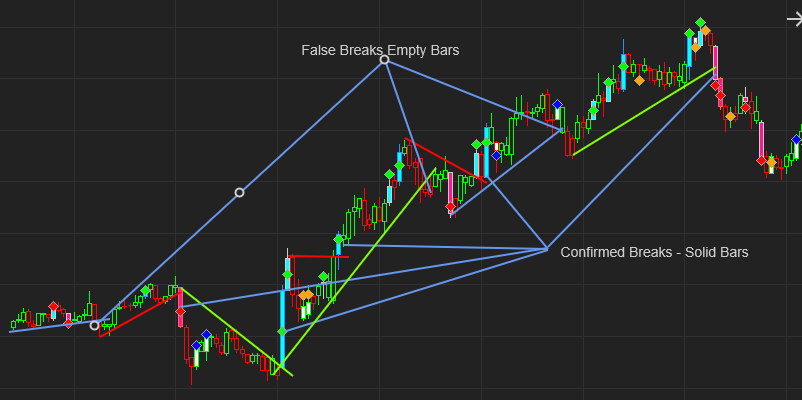
As you can see, the indicator Plots a solid Up/ Down bar (Blue and Pink) when the smart money is supporting or causing a break-out. These break-outs work really well and are extremely accurate.
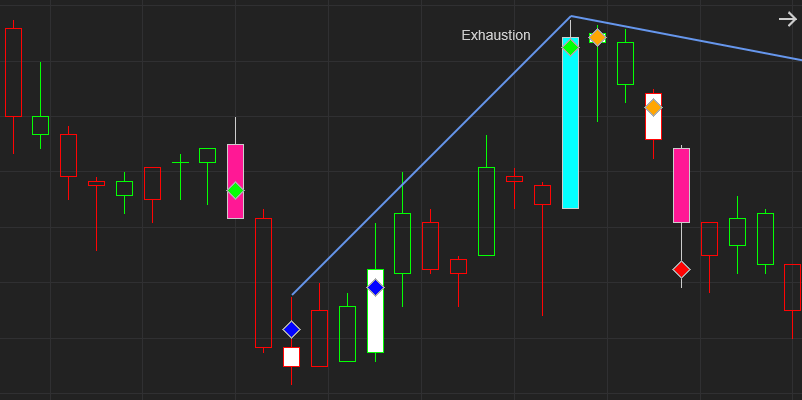
Volume Bars – Exhaustion
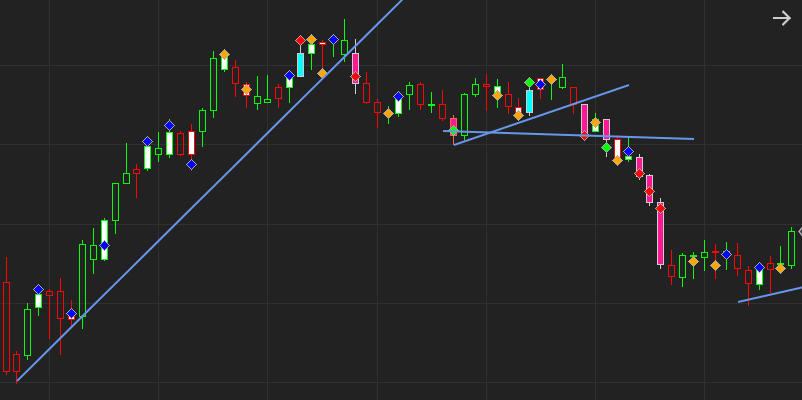
The smart money (SM) can also show us the end of a current trend as opposed to the start of a new trend as with a break-out.
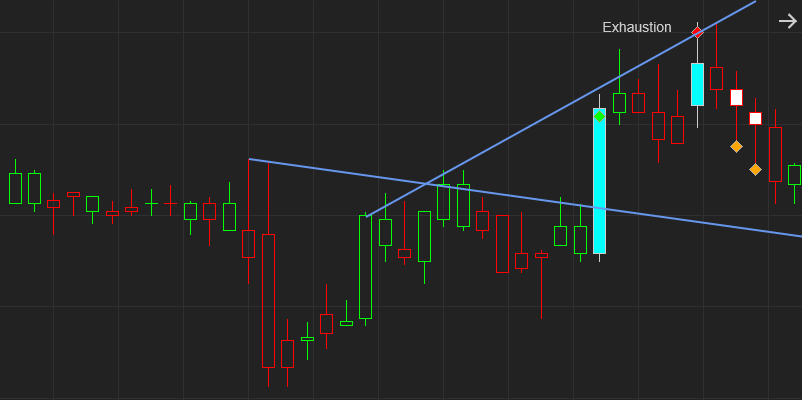
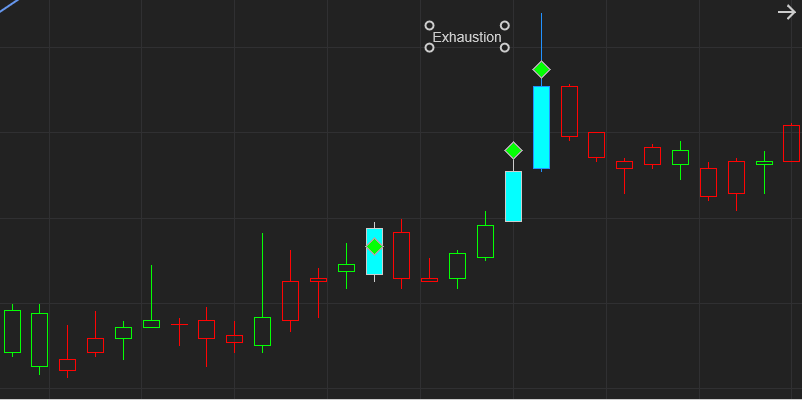
These exhaustion points occur at the top of a trend when the SM are selling aggressively.
Volume Bars – No Interest
The White filled bars shows us where the SM lost interest in the current situation. So , generally if the trend was down and the selling dries up ( no – interest) the market reverts back or consolidates in a range until the interest picks up again. These No interest bars are especially handy at support and resistance levels, see below.
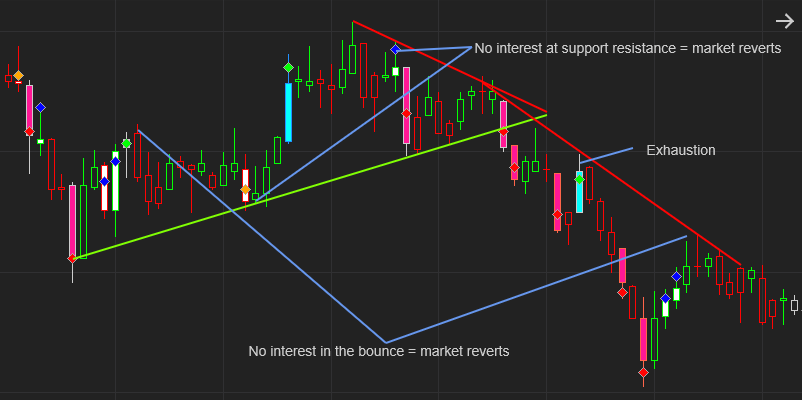
When there is no interest in the pullback , the markets also tend to reverse the move.
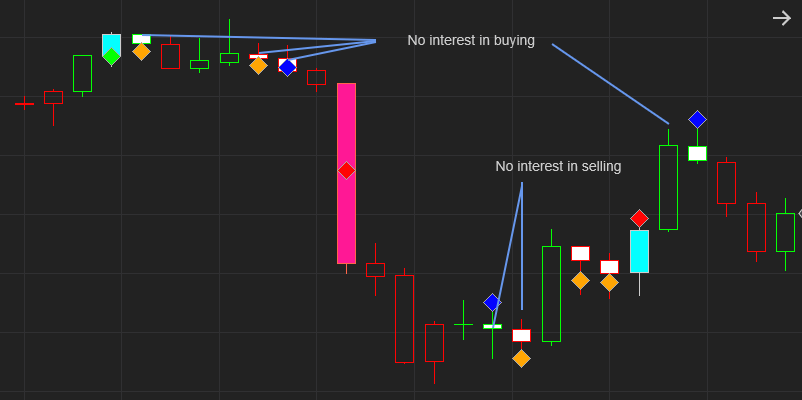
As you can see above, the market was in an up move, lost interest , move down swiftly, the sellers lost interest and so market move back up.
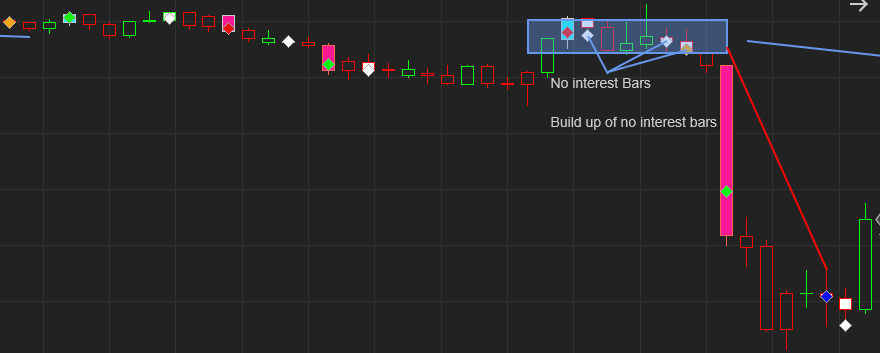
Volume Bars – Build Up
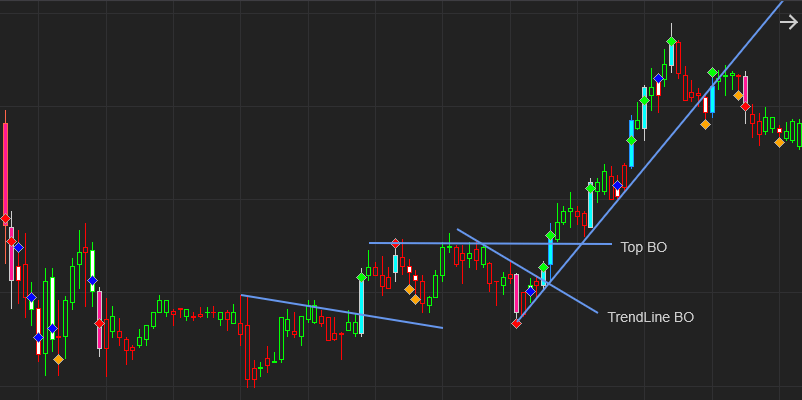
The market oscillates between periods of interest and no-interest and back to interest again. These periods of no-interest often create a state of consolidation from where the market breaks out again.
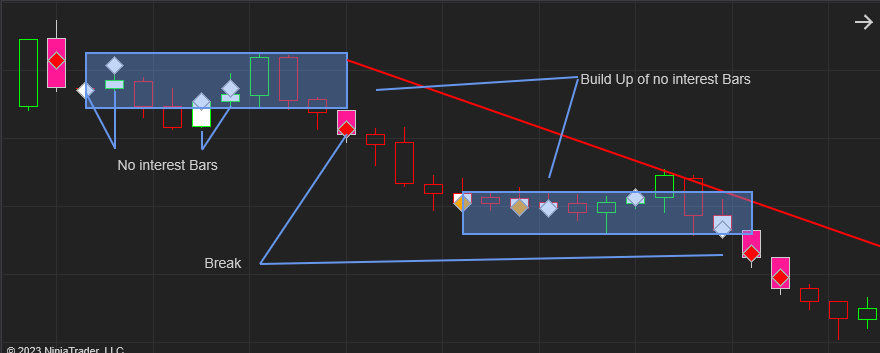
In both these examples we had more than 3 bars of no – interest and consolidation followed by a nice break – out.
Follow the Money
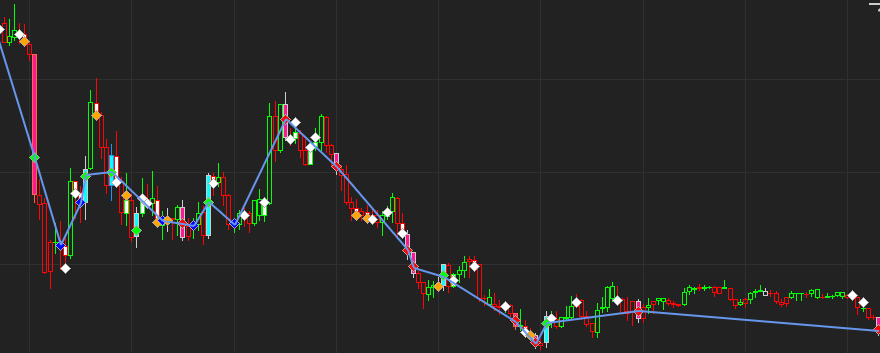
We have connected all the High Interest levels in the image below… It very clearly show us the flow of the Smart Money.
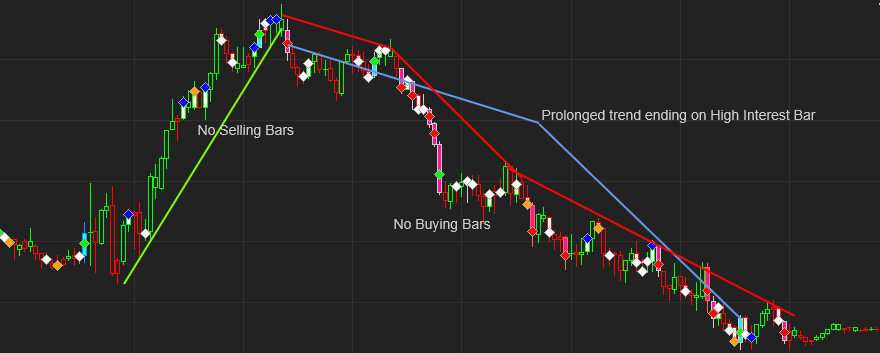
Major Trend Changes
These bars are extremely helpful in determining when an extended / prolonged trend is coming to an end. See the image below. In The up trend there were no Selling interest bars (Pink filled bars) and vice versa, in the down trend there were no Buying interest ( Blue filled bars) until the trend changed for good.
Key to Q-Volume Bars
The Blue filled Bars represent Bars of high interest from the Smart Money in Buying the instrument.
![]()
The Pink filled Bars represent Bars of high interest from the Smart Money in Selling the instrument.
![]()
The White Bars represent times of low to “No interest” by the Smart Money. The Outline color of these bars shows whether the low volume was positive or negative. (Net buying or net selling on low interest)
![]()
The Outline colors of these bars are either White or the same color as the bars. If its White it means that there is Good interest and when its the same color as the bar it represents Very Good interest.
The Diamonds inside the bars show us the level where the support / resistance was created inside the bar.