Q-VPSR

  1. Home
  2. /
  3. Q-VPSR

This Ninjatrader Indicator is based on Volume Profile.  It’s an amazing tool for finding break-outs and support and resistance.

Learn how Q-VPSR works

Q-VPSR

Volume Profile is a very effective means of finding support and resistance. These SR levels often repeat in to the future. The market has some memory.

These levels are not necessarily swing highs or lows. They are levels where the market found significant Volume, supply and demand were balanced and then moved beyond this “equilibrium” point. These levels act like magnets, drawing the market towards it and pushing the market away from it. (Reversion / Momentum)
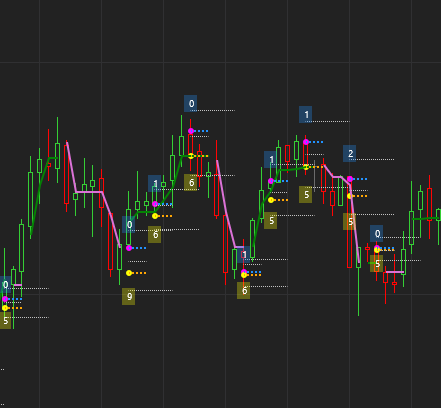
Q-VPSR in Action

Q-VPSR Description:

Nuts and Bolts

We know how important “to-the-tick” accuracy is, missing an entry by 1 tick or an exit by 1 tick can make All the difference in your P and L. That is why we aim to find the Real Support and the Real resistance. We try to get closer to every tick possible.

* Level Significance: This number (“1” in a Blue border) tells us how many times this level has been a Significant Level in the past.

* Time Forecast: This metric forecast the number of bars before a new Significant Level should be reached. It aims to tell in terms of time, how Long duration this move could have.

* Resistance: This is the Level based on the Volume Profile where the most resistance was met.

* Support: This is the Level based on the Volume Profile where the most  support was met.

* Upper Range: a Break Above this level signals a potential Break – Out to the Upside

* Lower Range: a Break Below this level signals a potential Break – Out to the Downside

* Trailing Stoploss: The Indicator plots this very efficient curve to use as a TSL.

Q-VPSR
Q-VPSR

Q-VPSR - Accurate Support and Resistance Levels Forecasting

  • Generally, We like to use previous Swing Highs and Lows as Support and Resistance (SR) levels. As you can see in the image above, QVPSR finds these levels more accurately.
  • In the example above the Swing Highs and Lows proved not be any Support nor Resistance. This is very often the case.

Q-VPSR – Trade Set-ups:

Great for trading Momentum Break-outs!

Q-VPSR

Q-VPSR: Trend Changes

  • In this Volume Profile indicator, the Curve gives you very fast Trend changes with minimal whipsaw.
  • Green Curve = Trend Up, Magenta Curve = Trend Down.

Q-VPSR

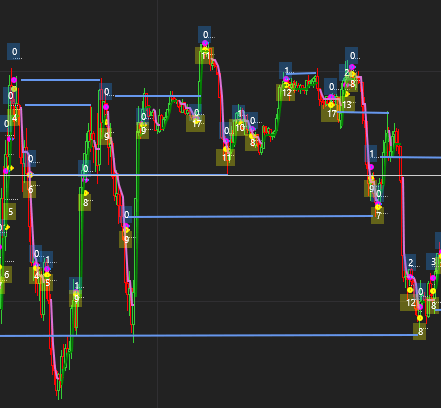
History repeating itself

  • We connected (Blue Lines) the SR levels in this image, It clearly shows how the past VP levels turned out to be the current SR levels.
  • The Swing Highs and Lows were far off the mark.

Q-VPSR

Q-VPSR - More Features:

  • It works on all instruments and
  • All Time Frames. Note that its Not intended for Timeframes >= Day
  • Plots are customizable
  • It works on Renko and Heikin -Ashi but its unnecessary to use these bar type as we use custom filtering techniques to filter the data which negates the need for them.

Settings:

The User can turn most of the features On or Off.

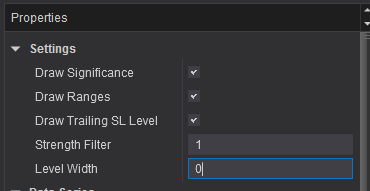
* Draw Significance: This will draw the Level Significance number of times a level was hit when ticked.

* Level Significance: This number (“1” in a Blue border) tells us how many times this level has been a Significant Level in the past.

* Draw Ranges: This will draw the upper and lower ranges Levels if ticked.  See:

Upper Range: a Break Above this level signals a potential Break – Out to the Upside.

Lower Range: a Break Below this level signals a potential Break – Out to the Downside.

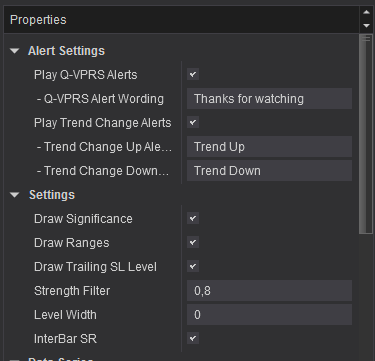
* Draw Trailing SL Level: If ticked, this will draw the Trailing Stoploss / Trend Indicator curve.

* Strength Filter: This Setting determines how Significant a Volume Profile Level must be in terms of Volume. 1 is average,  “0” is not significant and 2 would be very significant. The lower this setting, the more signals you will get and vice versa. More signals may be less significant.

* Level Width: When this is set to “0”, The indicator will plot/extend the SR and Ranges lines by the period of the the Time Forecast, ie” X Bars. If you set this to any number but “0” the indicator will extend/ plot the lines to the number of bars that you have set.

Volume Profile (VP) Levels:

You can find potential Profit Targets by looking at previous Volume Profile (VP) levels, find these Profit Target  levels by looking at your current VP  level and the general range of the market, How large are moves currently?

Stoplosses makes sense if you place them at the VP level above/ below the current VP level.

Trailing stoplosses can work if you use the Trend Curve from this indicator. an Idea might be to stay with the Stoploss Level initially until the market has moved enough in your favor ( got out of the noise) and only then trail the stoploss with the Trend Curve.

You can easily determine your risk reward per trade buy simply looking at the previous VP levels and comparing this to your entry level.

Alerts

We have added some very handy audio alerts to this indicator. These alerts will “Say what you tell it to say” when the alert is triggered.

Please watch the video to see how it works.

This is a really efficient scalping indicator!

has been added to your cart!

have been added to your cart!