Table of Contents
- Introduction & Overview
- Risk & Money Management
- Entry Conditions
- Profit Targets
- Stoploss
- Indicators
- Dashboard
- Visual
- Appendix
1. Introduction & Overview
Q-Bars Strategy Builder (QBSB) is a professional-grade trading strategy framework designed for clarity, adaptability, and precision.
This manual outlines core components, configurable settings, and visualization techniques to support both development and live deployment.
2. Risk & Money Management
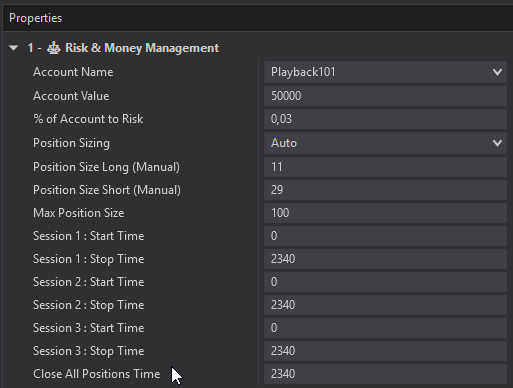
Account Configuration:
| Setting | Description | Example Value |
| Account Name | Select your account here | Playback101 |
| Account Value | Capital Allocated | 50 000 |
| % of Account to Risk | Fraction of Capital risked per trade | 0.03 (3%) |
| Position Sizing | Auto or Manual sizing logic | Auto |
Manual Position Controls:
| Setting | Description | Example Value |
| Position Size Long (Manual) | Contracts for manually sized long trades | 11 |
| Position Size Short (Manual) | Contracts for manually sized short trades | 29 |
| Max Position Size | Limits total contracts per trade | 100 |
If Position Sizing is set to “Auto” the strategy will determine the number of contracts to trade based on the Account Value , % of Account to Risk and
the Stoploss level as set by the user .
Example :
$ 50 000 account value * 0.01 (1%) = $ 500 risked per trade.
If the Stoploss level is 5 points below the entry level (long entry) and the value per point per contract = $20 , then 500 / 20 = 25 Contracts to be traded. This is extremely helpful in managing risk and limiting drawdowns.
Session Time Management:
| Session | Start Time | Stop Time |
| Session 1 | 0 | 2340 |
| Session 2 | 0 | 2340 |
| Session 3 | 0 | 2340 |
| Close All | N/A | 2340 |
Tip: Format time using 24-hour clock for clarity. “2340” equates to 11:40 PM.
You can define up to 3 distinct trading sessions here. The strategy will only Enter trades in the defined sessions, but it will exit open trades irrespective of the session.
The Close All time setting allows you to set the time when All Orders Must be cancelled, All positions exited and Trading stops. Handy to use so as not to carry positions overnight.
Example :
Session 1 : Start Time = 0600 Stop Time = 0900
Session 2: 0930 to 1230
Session 3: 1400 to 1620
Close All : 1625
3. Long and Short Entry Conditions
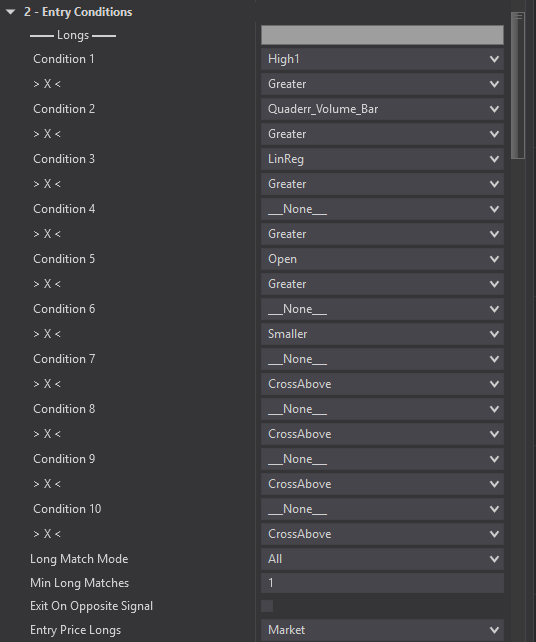
This configuration defines up to 10 Long and 10 Short entry conditions using selected indicators and comparison operators. Each row corresponds to a condition evaluated in real time.
| Condition # | Signal Type | Comparison Operator | Status |
|---|---|---|---|
| 1 | High1 | Greater | Active |
| 2 | Quaderr_Volume_Bar | Greater | Active |
| 3 | LinReg | Greater | Active |
| 4 | None | Greater | Inactive |
| 5 | Open | Greater | Active |
| 6 | None | Smaller | Inactive |
| 7 | None | CrossAbove | Inactive |
| 8 | None | CrossAbove | Inactive |
| 9 | None | CrossAbove | Inactive |
| 10 | None | CrossAbove | Inactive |
Matching Settings
| Setting | Description | Value |
|---|---|---|
| Match Mode | Defines how conditions are aggregated | All |
| Min Long Matches | Minimum number of true conditions required | 1 |
| Exit On Opposite Signal | If enabled, opposite signal will close trade | Yes |
| Entry Price Logic | Price level used to trigger entry | Market |
Comparison Operator:
Greater : The Close is above the signal type.
Example : Close > EMA 20
Smaller : The Close is below the signal type.
Example : Close < EMA 20
CrossAbove : Close Crosses above the EMA 20 ( Close was smaller than the EMA 20 in the previous period)
CrossBelow : Close Crosses below the EMA 20 ( Close was greater than the EMA 20 in the previous period)
Lets walk through an example here.
In the settings above we have selected and defined 4 conditions to enable a Long Entry Signal.
Condition 1: High1
Comparison: Greater
Thus the Close must be greater (above) the previous High (High1)
Condition 2: Quaderr_Volume_Bar
Comparison : Greater
Thus the Quaderr_Volume_Bar must signal a Long signal.
Condition 3 : Linreg
Comparison : Greater
Thus the Close must be greater (above) the Linreg indicator.
Condition 3 : Open
Comparison : Greater
Thus the Close must be greater (above) the Open.
The matching settings work as follows.
LongMatchMode = All , → ALL of the selected conditions must be true before a signal is generated.
LongMatchMode = Any → ANY of the selected conditions can be true before a signal is generated. Min Long Matches = How many signals must be true before a signal is generated.
Example : You have defined 5 conditions with (LongMatchMode = Any ) but only 3 needs to be true
The settings for all indicators are defined later on in the setup process.
Available conditions :
We have added 25 Quaderr Indicators and 45 standard indicators and price action tools for you to explore. On top of that you can also use 10 candlestick patterns.
_None_
- Quaderr_Close_vs_IB_POC
- Quaderr_Close_vs_IB_vwap
- Quaderr_Close_vs_LowerPivot
- Quaderr_Close_vs_MicroSR
- Quaderr_Close_vs_Resistance
- Quaderr_At_Resistance
- Quaderr_Close_vs_Support
- Quaderr_At_Support
- Quaderr_Close_vs_TrendLineLower
- Quaderr_Close_vs_TrendLineUpper
- Quaderr_Close_vs_UpperPivot
- Quaderr_Delta_Bar
- Quaderr_Delta_Trend
- Quaderr_Momentum_Bar
- Quaderr_Momentum_Trend
- Quaderr_No_Interest_Bar
- Quaderr_No_Interest_Trend
- Quaderr_ReversalBar
- Quaderr_SignalTrend
- Quaderr_SuperHeat
- Quaderr_Trend
- Quaderr_TrendDelta
- Quaderr_TrendLineLowerSlope
- Quaderr_TrendLineUpperSlope
- Quaderr_TrendMomentum
- Quaderr_TrendVolume
- Quaderr_Volume_Bar
- Quaderr_Volume_Trend
- ChaikinOscillator
- CMF
- Close_vs_BollingerLower
- Close_vs_BollingerMiddle
- Close_vs_BollingerUpper
- Close_vs_Close1
- Close_vs_DEMA
- Close_vs_EMA1
- Close_vs_EMA2
- Close_vs_EMA3
- Close_vs_Fibonacci_0236
- Close_vs_Fibonacci_0382
- Close_vs_Fibonacci_0500
- Close_vs_Fibonacci_0618
- Close_vs_Fibonacci_0736
- Close_vs_High1
- Close_vs_LinReg
- Close_vs_Low1
- Close_vs_Open
- Close_vs_RegChannelLower
- Close_vs_RegChannelUpper
- Close_vs_TEMA
- Close_vs_TSR
- Close_vs_VWAP
- Close_vs_VWAP_LowerBand
- Close_vs_VWAP_UpperBand
- Close_vs_WMA
- Close_vs_ZLEMA
- DonchianLower
- DonchianUpper
- MACD
- RSI
- RSI_Lower
- RSI_Upper
- RVI
- Stochastic
- Volatility_vs_Volatility1
- Volume_SMA
- Volume_vs_Volume1
- CP_BearishEngulfing
- CP_BullishEngulfing
- CP_Doji
- CP_EveningStar
- CP_Hammer
- CP_HangingMan
- CP_InvertedHammer
- CP_MorningStar
- CP_PiercingLine
- CP_ShootingStar
- EMA1_vs_EMA2
- EMA1_vs_EMA3
- EMA2_vs_EMA3
- High_vs_High1
4. Profit Target Settings
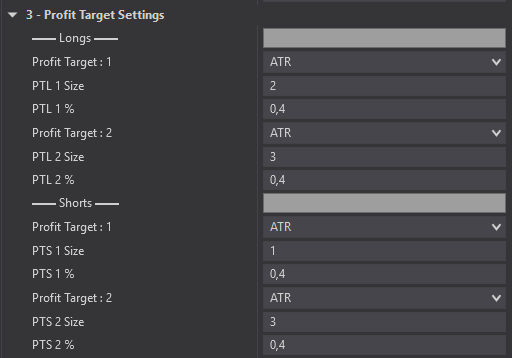
Each trade side (Longs and Shorts) has two profit targets with defined size and percentage thresholds.
| Trade Type | Profit Target | Size | % Threshold |
|---|---|---|---|
| Long | PTL 1 | 2 | 0.4 |
| Long | PTL 2 | 3 | 0.4 |
| Short | PTS 1 | 1 | 0.4 |
| Short | PTS 2 | 3 | 0.4 |
Each profit target has 6 distinct profit target methods to define profit targets with.
ATR : Average True Range , This period can be set and changed
Ticks : Number of ticks
SR : This method uses Quaderr`s Support And Resistance indicator to determine Profit Targets
Risk Reward : This method uses the stoploss set by the user to calculate profit targets based on the setting , example 1.5 RR , 3RR
TrendVarianceLarge : This is a method that calculates how large the Big price cycles are. It calculates and averages pivot high to pivot low but if it is a big cycle.
TrendVarianceSmall : This is a method that calculates how large the Small price cycles are. It calculates and averages pivot high to pivot low but if its a small cycle
Profit Target Percentage % : These settings allow you to determine what percentage of your position should be exited at each of the Profit Target levels.
You don’t have to us both or any of them per side as you can exit all (100 %) at the first or second profit target.
If you don’t set these values then 100% of your position will exit at the trailing stoploss.
The way we have it set up in the example is to exit 40 % at each of the 2 Pts and then ride the balance of 20% until the stoploss triggers.
5. Stoploss Settings
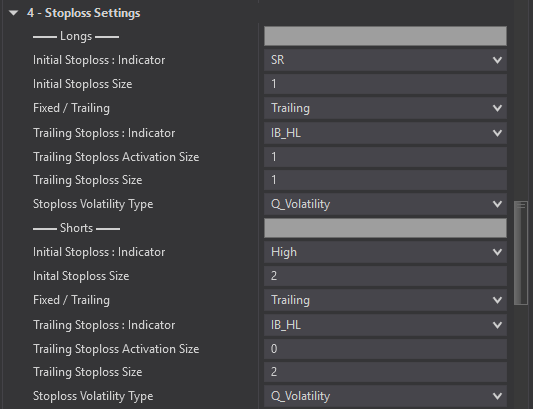
This tool allows you to create a smart Trailing stoploss algorithm.
It supports both an initial stoploss and a trailing stoploss. You can use either or both in your strategy.
Each strategy requires its own unique exit strategy, Some strategies need fast exits whilst others may require slow exits and wide stops.
It has 13 trailing stoploss methods to choose from , the one you choses depends on your trading style and the strategy you wish to develop.
Definitions:
Initial Stoploss indicator : Choose which indicator to use for your initial stoploss
Initial Stoploss Size : The Size by which the stoploss be below or above the Initial Stoploss Indicator.
Example : 2 ATR
Fixed / Trailing : Choose whether the stoploss is fixed or must trial.
Trailing Stoploss Indicator : Select ths indicator or method to use for your trailing stoploss if selected above.
Trailing Stoploss Activation Size ; this determines how far the price must move in you favour before the the Trailing Stoploss activates.
Example : for a long trade : Close > Entry Price + Trailing Stoploss Activation Size , then activate( start trailing)
Trailing Stoploss Size : The Size by which the stoploss must trail above ( short) or below ( long) the Trailing Stoploss Indicator
Example : Low minus Trailing Stoploss Indicator
IB_HL : This method tracks the Max or Min price from trade inception intra bar. Thus it updates with every tick . The stoploss size determines how far below (long) or above (shorts) the stoploss trials.
Open : Stoploss trial with the Open of every bar,
Example: Open – Trailing Stoploss Size ( Long Trades) Opposite for shorts.
High : Stoploss trial with the High of every bar,
Example : High– Trailing Stoploss Size
Low : Stoploss trial with the Low of every bar,
Example : Low – Trailing Stoploss Size
Low2 : Stoploss trial with the The Smallest of the current and previous Lows of every bar,
Example : MIN( Low, Low1) – Trailing Stoploss Size
Close : Stoploss trial with the Close of every bar, Example Close – Trailing Stoploss Size
SR : Stoploss trial with the Support or Resistance of every bar,
Example : Support – Trailing Stoploss Size.
The Support and Resistance is provided by a custom Quaderr indicator that trails SR levels very well.
POC : Stoploss trial with the intra-bar Point – of – Control of every bar, The intrabar Level with the most Volume. This makes for good micro Support and Resistance
Example : POC – Trailing Stoploss Size
Pivot : Stoploss trial with the most recent Pivot level, Pivots of the Lows for Long support Levels and pivots of the Highs for Short resistance levels.
Example Close – Trailing Stoploss Size
Median : Stoploss trial with the (High + Low) /2 of every bar,
Example Median – Trailing Stoploss Size
Median2 : Stoploss trial with the (MAX(High1 ,High) + MIN(Low1 ,Low) ) /2 of every bar,
Example Median – Trailing Stoploss Size
MicroSR : Stoploss trial with another custom Quaderr indicator that measures money flow intrabar
Example MicroSR – Trailing Stoploss Size
Price Action : Stoploss trial with another custom Quaderr indicator that looks at how the price action behaves.
Example PriceAction – Trailing Stoploss Size
Stoploss Volatility Type; (answers the Trailing Stoploss Size question)
There are numerous ways to measure the ideal Trailing Stoploss Size. Here we have 5 different methods to use.
ATR : Standard Average true range. This period used for the ATR calculation can be set in the indicator settings section.
Ticks ; number of ticks
High_Low : The High minus the Low of the current bar
Q_Volatility : a Custom model that we at Quaderr developed to better forecast and measure volatility and noise.
Trend_Variance_Small : a Custom model that we at Quaderr developed to better forecast and measure cycle Size
6. Indicator Settings
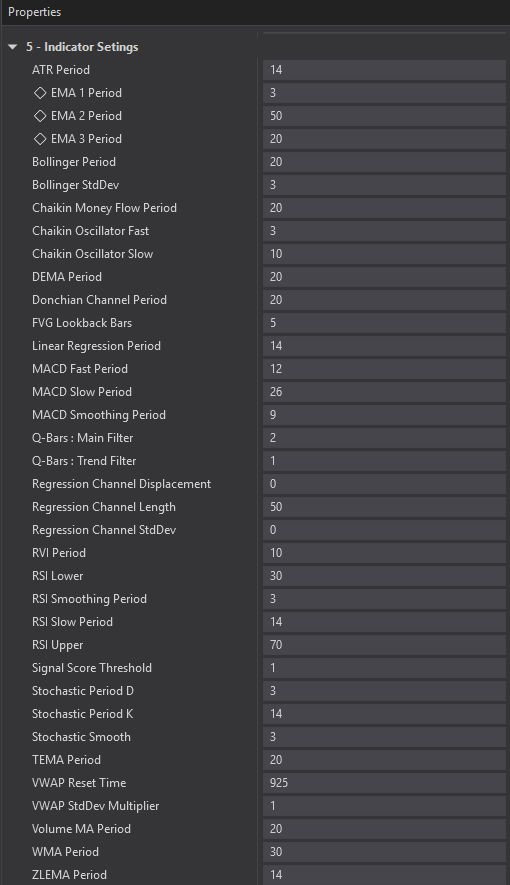
All the indicators that are available to use in your strategy can be edited in this section.
7. Dashboard Settings
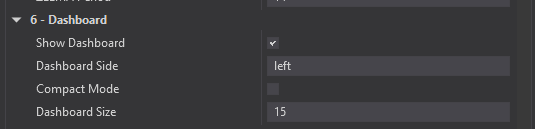
| Setting | Value | Description |
|---|---|---|
| Show Dashboard | ✅ Enabled | Displays the strategy dashboard |
| Dashboard Side | Left | Positions dashboard on the left-hand side |
| Compact Mode | ❌ Disabled | Uses full layout rather than condensed version |
| Dashboard Size | 15 |
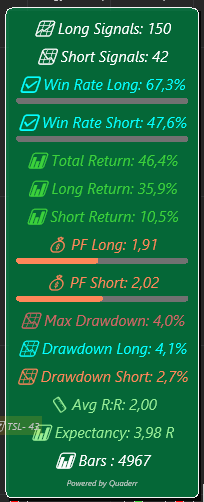
| Metric | Example Value | Details |
|---|---|---|
| Long Signals | 150 | Total long entries generated |
| Short Signals | 42 | Total short entries generated |
| Win Rate Long | 67.3% | Long trade success rate |
| Win Rate Short | 47.6% | Short trade success rate |
| Total Return | 46.4% | Combined return (long + short) |
| Long Return | 35.9% | Profit from long trades |
| Short Return | 10.5% | Profit from short trades |
| Profit Factor Long | 1.91 | Ratio of profit to loss for long trades |
| Profit Factor Short | 2.02 | Ratio of profit to loss for short trades |
| Max Drawdown | 4.0% | Largest observed peak-to-trough decline |
| Drawdown Long | 4.1% | Long-only drawdown |
| Drawdown Short | 2.7% | Short-only drawdown |
| Average Risk:Reward | 2.00 | Mean ratio across all trades |
| Expectancy | 3.98 R | Average return per trade in R units |
| Bars Analyzed | 4967 | Total bars scanned during backtest |
The dashboard provides you with a backtested answer for the strategy that you are building.
It Calculates all the statistics shown above based on all the data you have loaded on the chart. Every time that you make a change to your strategy it will recalculate the result.
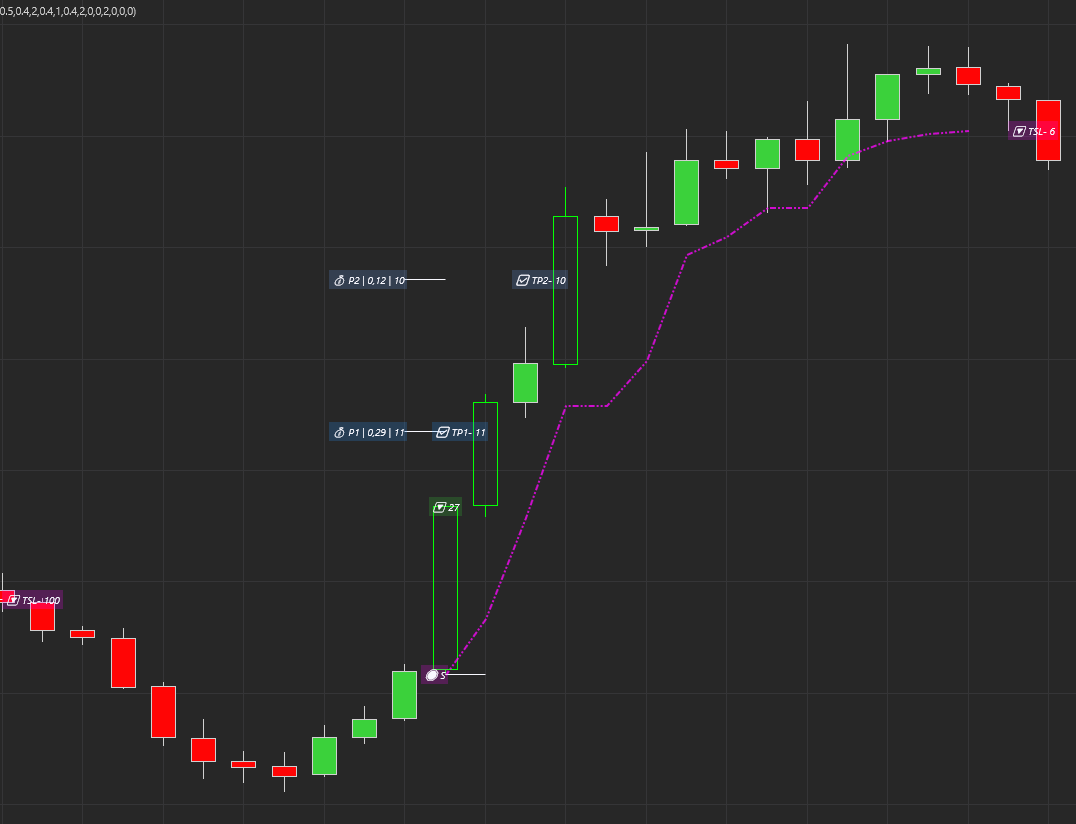
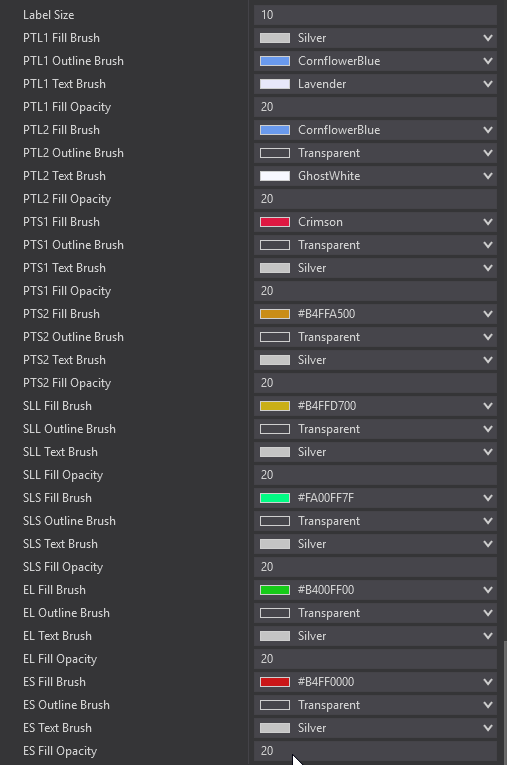
8. Visual Settings
Here you can customize the display for all the labels that’s plotted on the chart. These labels show:
- Entry Level and Position Size
- Profit Targets 1 and 2
- Trailing / Stoploss level It also plots labels every time a position or part thereof exits.
You can Set the following:
- Size
- Outline Color
- Fill Color
- Fill Opacity
Trade Management
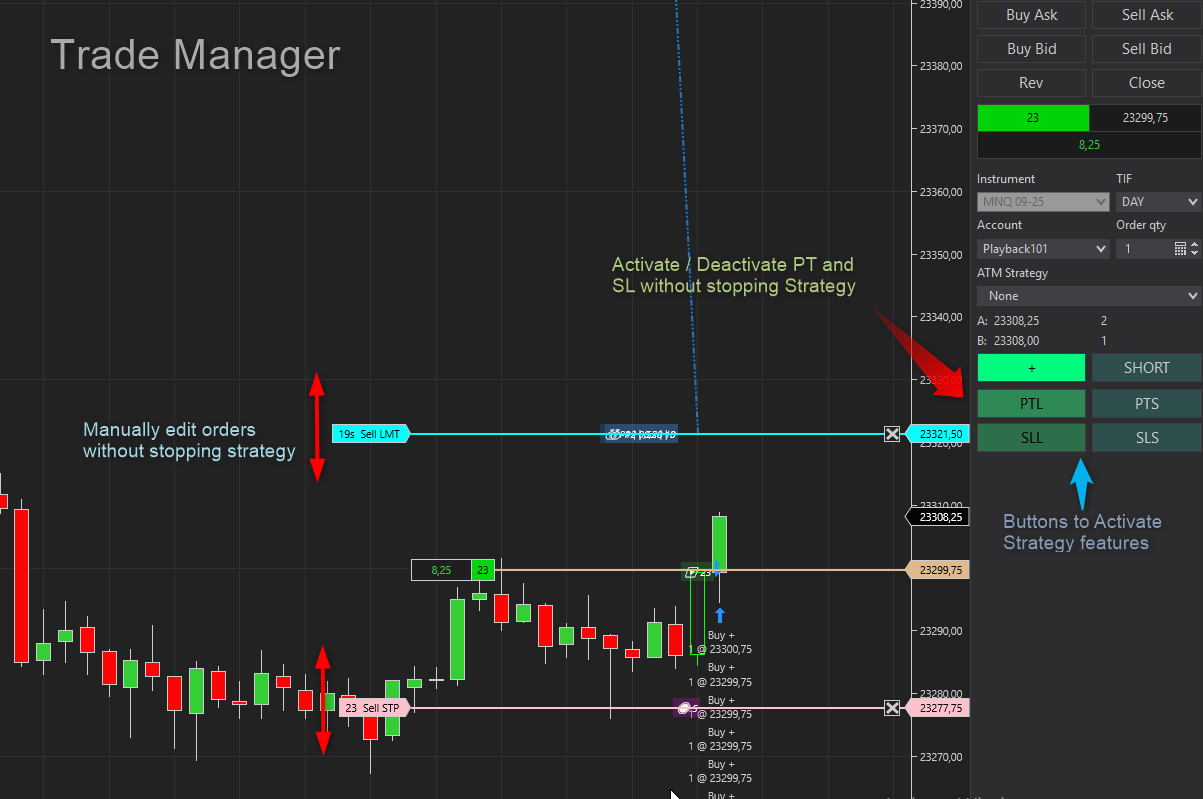
With a standard strategy you are not able to edit the orders that the strategy places without stopping / disabling the strategy. With our Trade Manager you are able to ;
- Edit the order prices up and down whilst in a trade
- Cancel / Disable Profit Target and TSL orders.
- Re-submit PTL and TSL orders, the strategy will simply find the position and resubmit the orders based on the positions that are still open.
- Manually increase the position, the strategy will then adapt the orders to the new position held
- Manually decrease the position, the strategy adapts the orders to the new position.
You can run a semi-auto strategy this way, as an example, you can let the entries enter automatically and exit the positions yourself manually or you can enter manually and let the strategy manage the exits.. Or simply run it in full Auto mode. This gives you complete control.
How to Build a Strategy
Building a strategy with Q-Bars Strategy Builder is a structured and intuitive process. It revolves around selecting your trade logic, configuring risk parameters, and visualizing performance — all while maintaining full control over customization.
1. Define Risk Profile
- Choose account parameters, percentage to risk, and position sizing logic (Auto vs Manual).
- Set session times and cutoff to control when entries are allowed and when open trades are closed.
2. Configure Entry Conditions
- Select up to 10 Long and 10 Short conditions using signals from indicators or candlestick patterns.
- Set the Matching Mode:
All: All conditions must be true.Any: Any condition may be true (with a Min Matches threshold).
- Choose your comparison logic (Greater, CrossAbove, etc.) to define how conditions are evaluated in real time.
3. Select Entry Price Logic
- Decide whether to enter at Market or specify a custom logic for price triggers.
4. Set Profit Targets
- here
5. Configure Stoploss
- Choose Fixed or Trailing.
- Define trailing logic using 1 of 13 methods:
- From classic levels (Open, High, Low) to advanced indicators (IB_HL, Quaderr SR).
- Set activation size and trailing offset for dynamic control.
6. Tune Indicators
- Adjust periods, smoothing values, or comparison thresholds to suit your market and timeframe.
- Use default presets or tailor your own parameters.
7. Enable and Customize the Dashboard
- Turn on the dashboard and choose layout preferences.
- Review live metrics such as:
- Win rate
- Profit factor
- Expectancy
- Drawdowns
- Every time you update the strategy, stats auto-refresh using your loaded dataset.
8. Style Your Visual Elements
- Customize chart label appearance:
- Entry and position size
- Profit Targets 1 & 2
- Stoploss/trailing levels
- Adjust label size, fill color, border, and opacity for clarity.
9. Iterate and Validate
- Backtest with different indicator combinations.
- Fine-tune conditions to reduce false signals and improve return profiles.