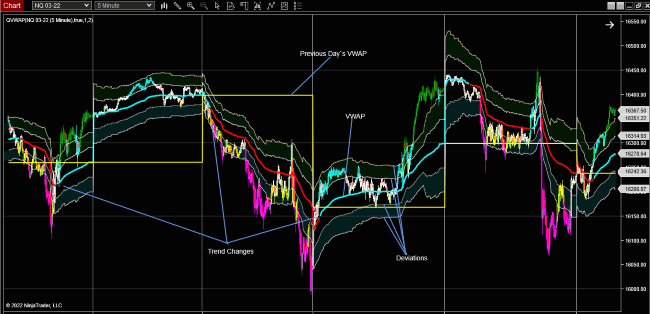
VWAP is a very handy Ninjatrader Indicator for day traders as it gives you a lot of information on the current day’s trend, variance, support and resistance.
It starts calculating the average at the start of the trading day and end at the close of the market. Furthermore it also calculates the deviations from this average. Very much like a Bollinger Band calculates on average with deviations around this average.
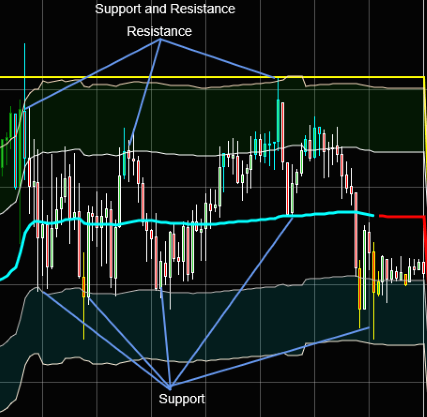
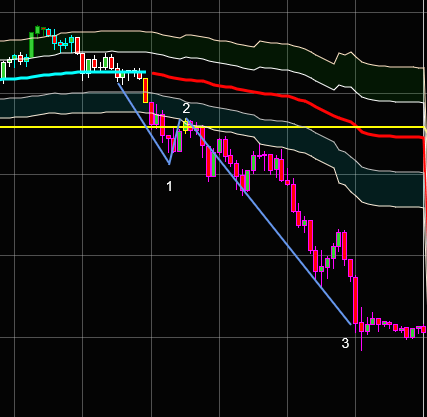
The deviation bands along with the average also provides day traders with accurate support and resistance levels. When the market moves above or below the two deviation levels it generally signals strong breakouts. When the market are within these levels it suggests a range bound market.
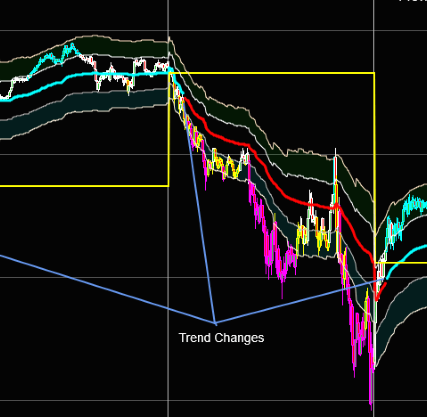
Daily trend changes can also be seen when the VWAP curve changes color from red to blue and vice versa.
How to Trade VWAP?
Our VWAP Indicator really detects major trend changes accurately with absolute minimal whipsaw. The deviation bands are also very accurate in detecting support and resistance levels.
VWAP – Summary


