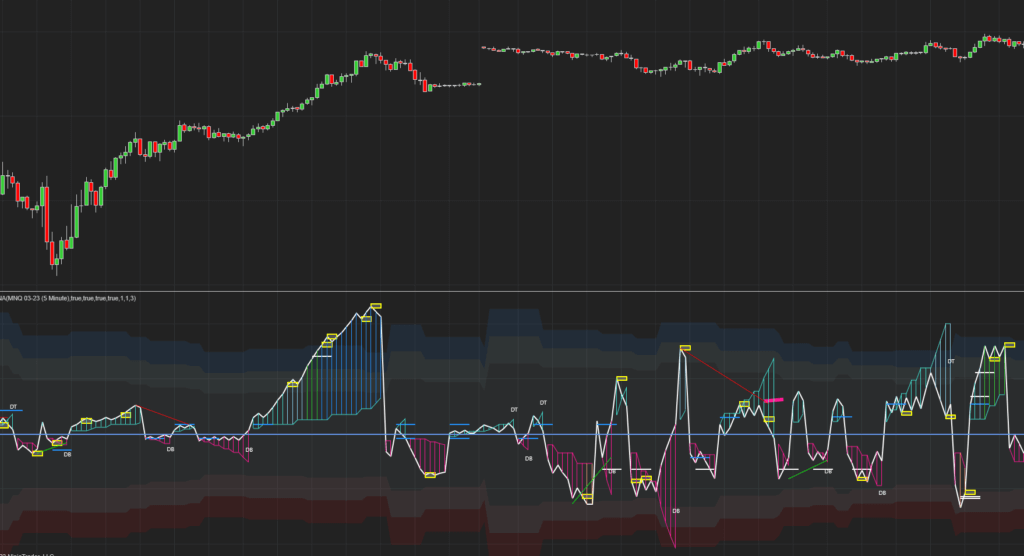
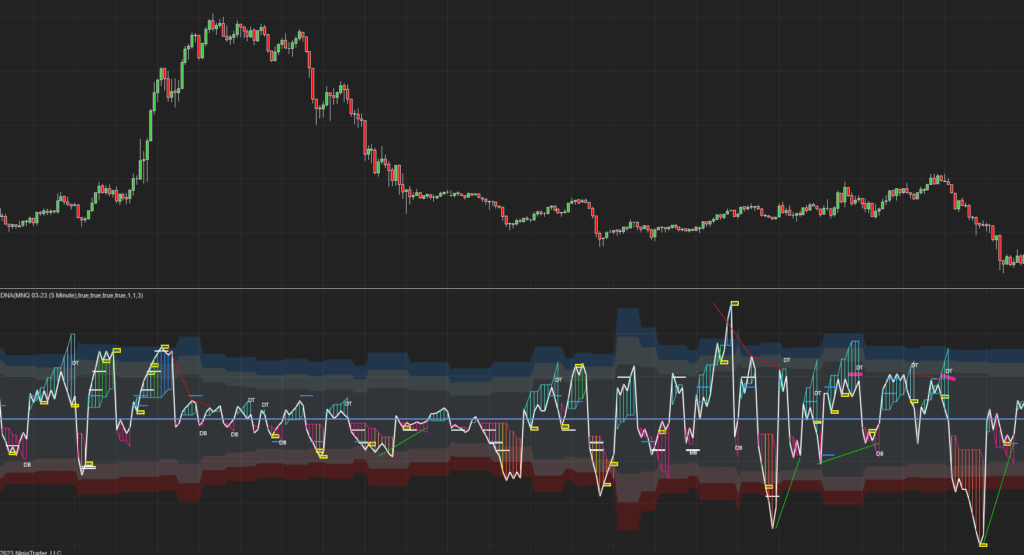
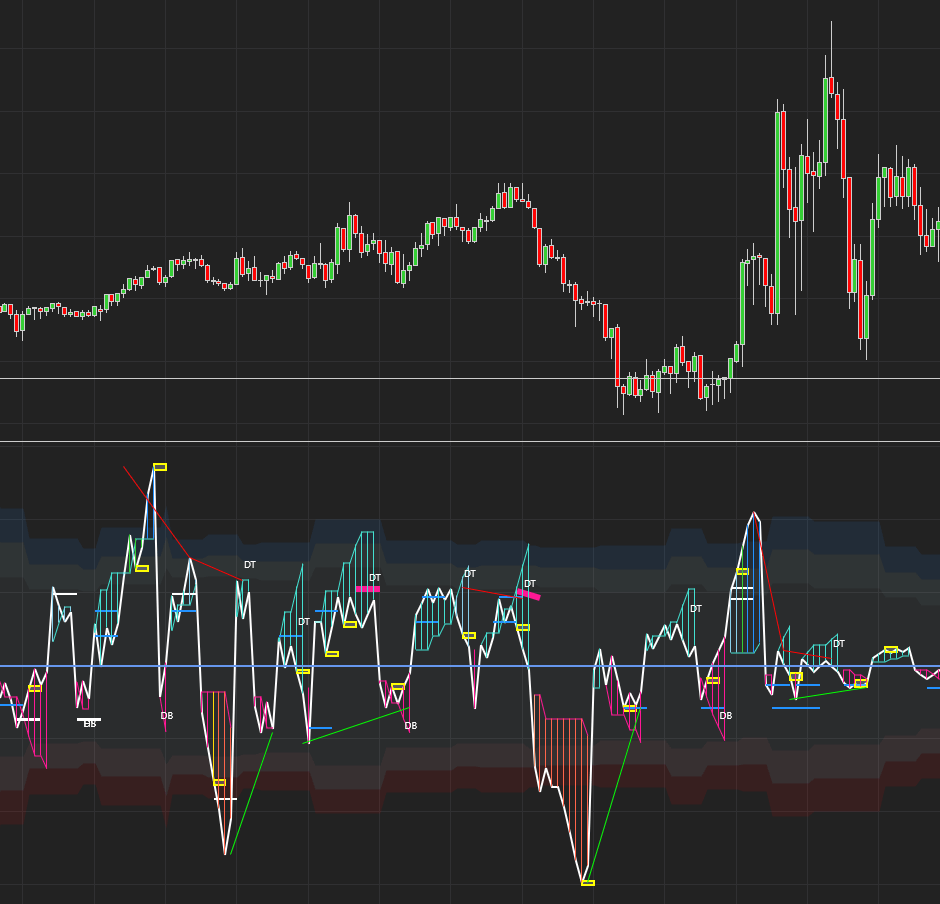
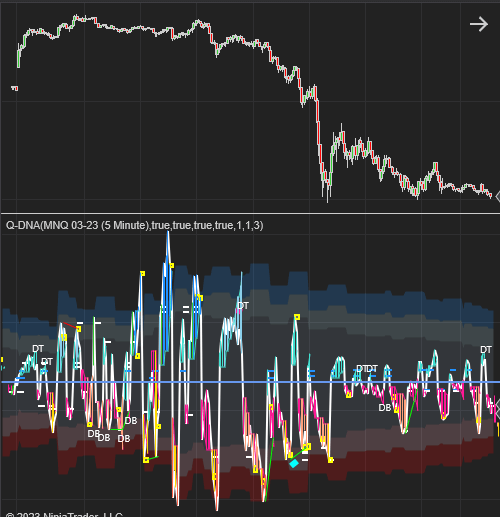
Q-DNA
We named this indicator Q-DNA as it aims to delve in to the DNA of the market by “sequencing” volume , price and time. It then compares and measures the relationship between the three to give us accurate measures for volatility, trend changes, support, resistance, divergence between volume and price, over-bought-oversold areas and Double Bottom / Double Top patterns. We have developed tis indicator for the Ninjatrader platform.

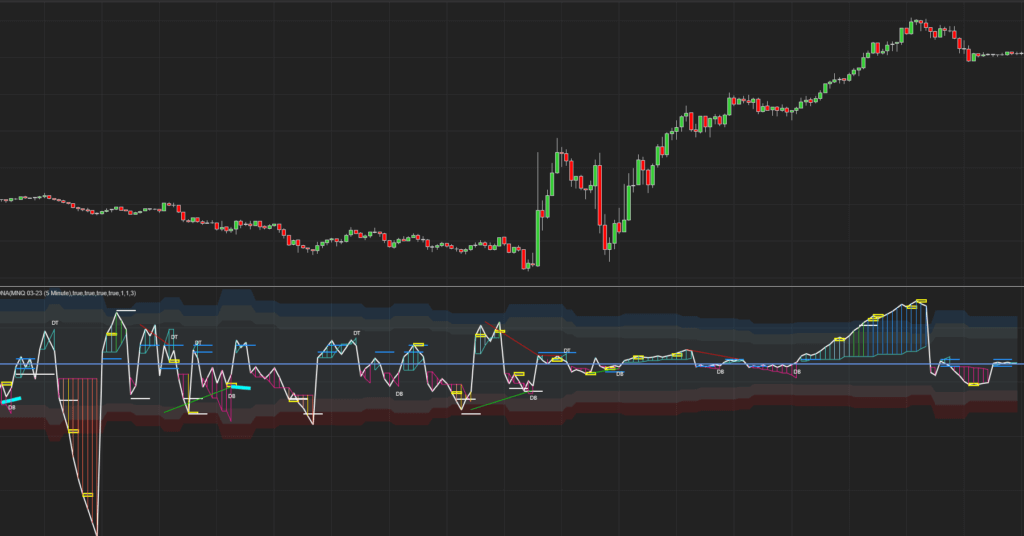
Volume Delta
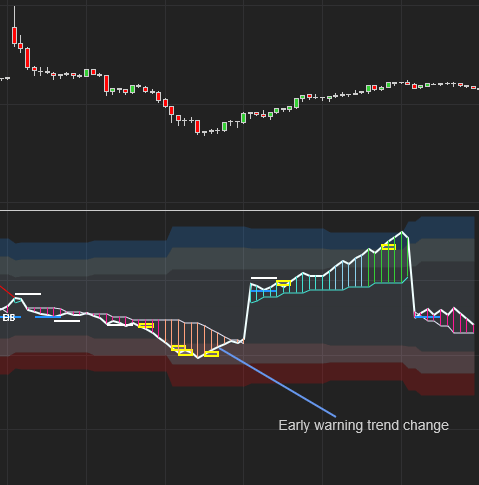
Volume Delta – We use a derivative of the standard Volume Delta calculation to calculate the Volume Delta within each swing. In other words the Volume Delta resets when ever there is a trend change. This is very helpful as we can very often see a trend long before the market confirms this.
Noise Delta
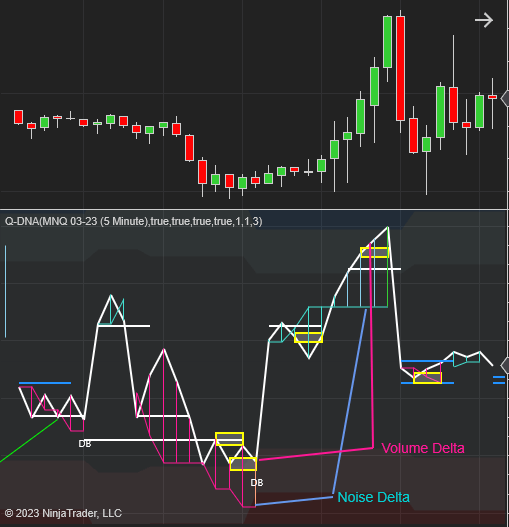
The Noise Delta simply cumulates the Volume Delta according to all the price changes that is counter to the prevailing trend. We found that moves with a “noise” values larger than the Volume delta produces powerful moves in the opposite direction. Consider the image to the left. the Noise Delta in the down move was larger than the Volume Delta – This was followed by a very powerful move upwards.
New Support and Resistance
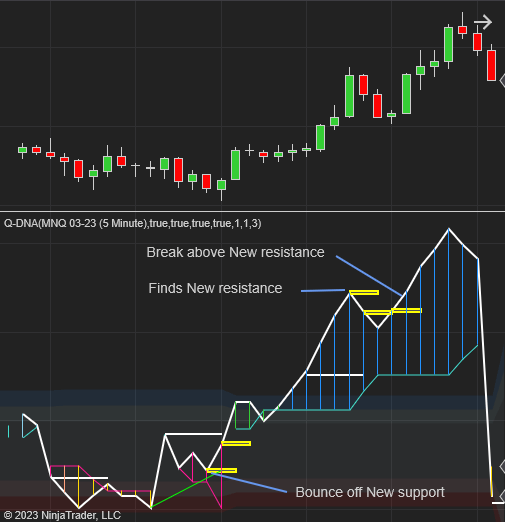
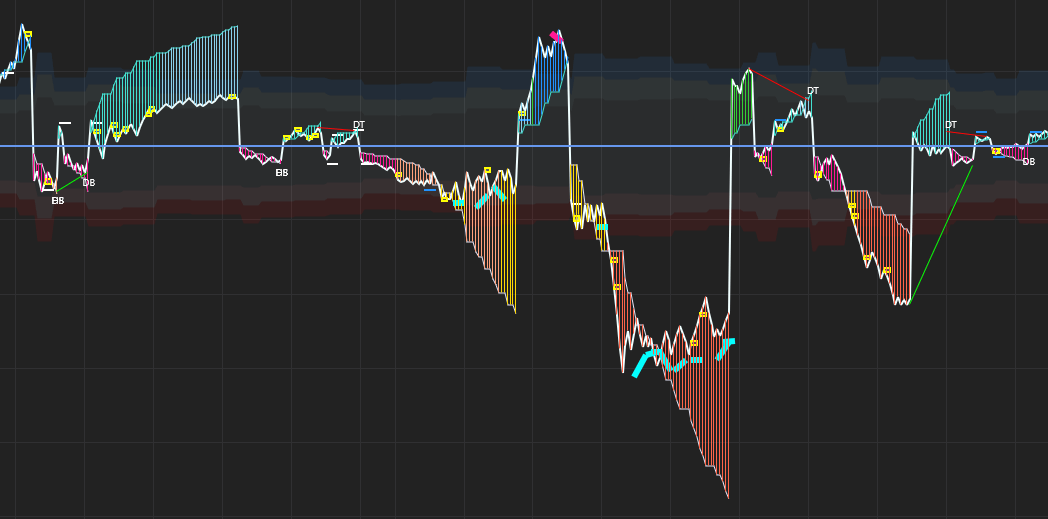
New Support and Resistance – The yellow rectangles represents levels where the market makes new Support and Resistances. When the VD ( Volume Delta , White plot) moves away from these rectangles it signals great trading opportunities.
Previous Support and Resistance
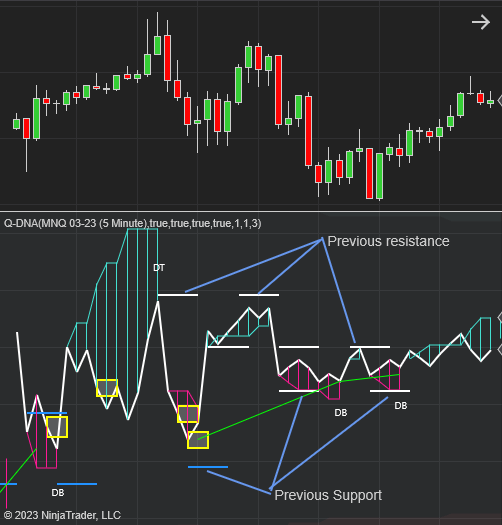
Previous Support and Resistance -The white and Blue SR lines show up when the VD approaches previous Support and Resistance levels. These make for great reversal as well as great break-out trades.
Major Divergences
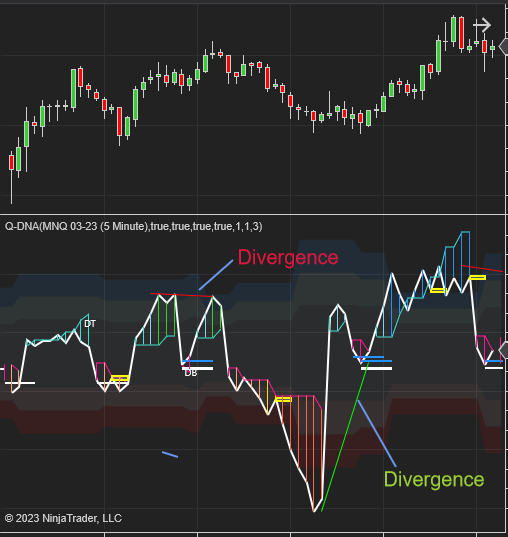
Major Divergences – The indicator also plots these Red and Green lines to show when there are major divergences between Volume And Price. Example: Price cycles moving higher whilst Volume cycles are moving lower. These divergences often produce large moves.
Minor Divergences
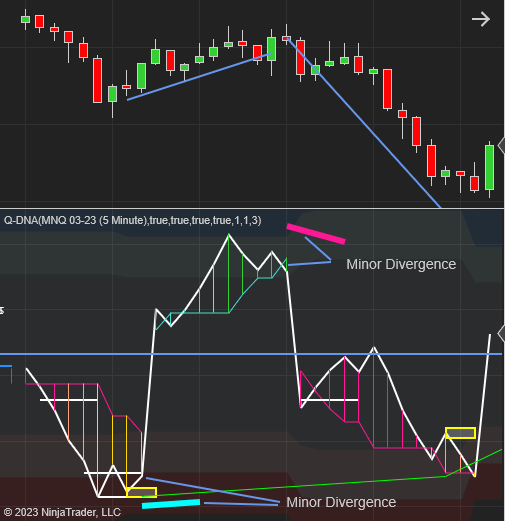
Minor Divergences – These Pink and Cyan plots show up when there is a small divergence between volume and price within a trend as opposed to the Major Divergences which looks for divergence between cycles / pivots as seen above.
Patterns
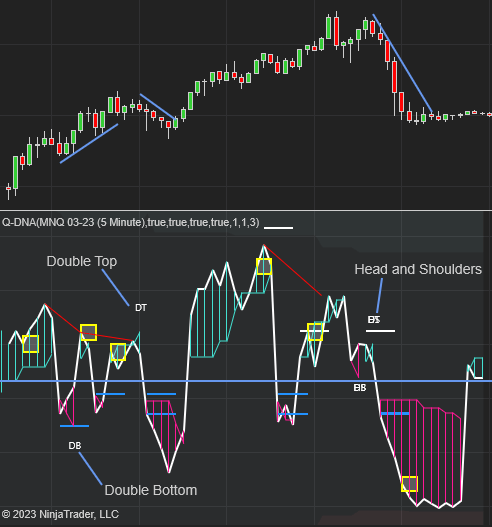
Patterns – Double bottom ,double top and head and shoulders patterns also show up in the Volume Delta an delivers great trades. the indicator automatically draws “DB” , “DT” and DHS when these patterns present themselves.
Volatility bands
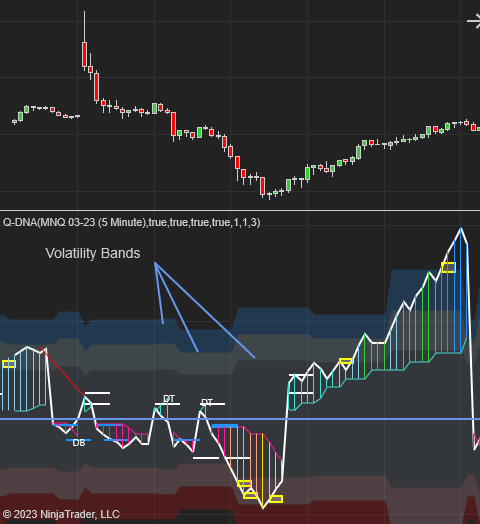
Volatility bands – These band measures the size of past swings and expresses this in Average ( Dark gray) , Average + One Standard Deviation ( Light Gray / Light Pink) and Average + 2 Standard Deviations ( Blue / Red). We use them in much the same way as you would use Bollinger bands except we find this to work a lot better since the model is adjusted for other factors and variables as well.
Momentum Break – Outs
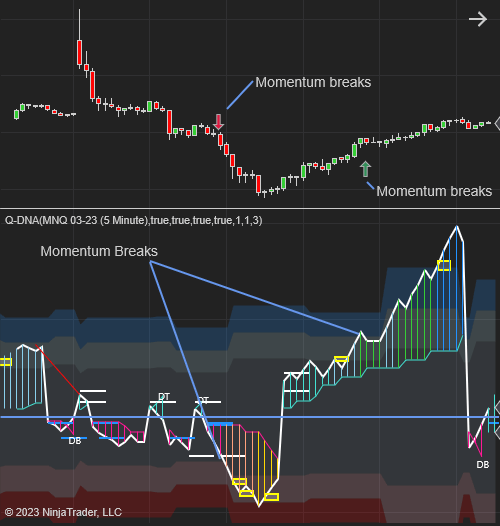
Momentum breaks – based on our volatility bands we found that a break above / below the first band ( Average / Dark Gray) generally signal that the market is gaining Momentum and the trend could pursue strongly.
Reversals – Over Bought Over Sold

This indicator measures and shows OB / OS levels better than most other indicators. This also helps us see divergences more accurately and give us a far better estimation of “how much” Overbought and oversold should be.
More Features
- It works on all instruments and
- All Time Frames. Note that its Not intended for Timeframes >= Day
- Plots are customizable
- It works on Renko and Heikin -Ashi but its unnecessary to use these bar type as we use custom filtering techniques to filter the data which negates the need for them.
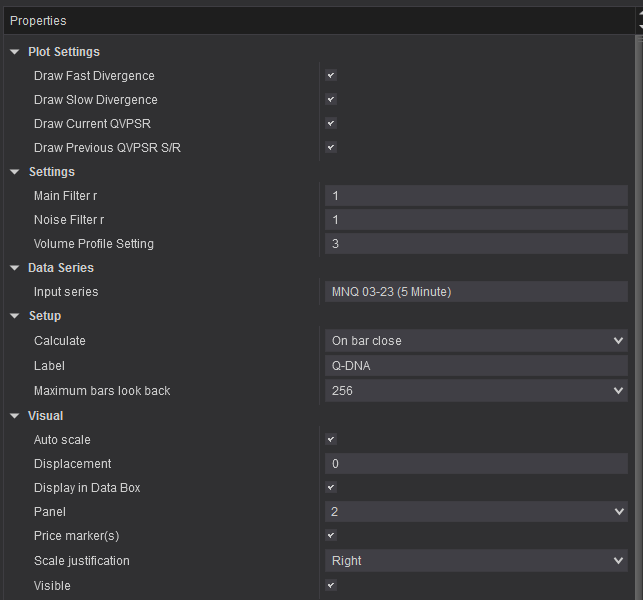
Settings

For more products, browse our indicator page here: https://quaderr.com/indicators/
Happy Trading!