Power Wicks

  1. Home
  2. /
  3. downloads
  4. /
  5. Power Wicks

Power Wicks

$295.00

Understanding Smart Buyer and Smart Seller Intra-Bar Dynamics

The Power Wicks trading indicator provides crucial insights into the intra-bar dynamics of Smart Buyers and Smart Sellers, akin to modeling supply and demand within a specific timeframe. What sets this analysis apart is its focused examination of the “Smart Money,” which yields valuable information for making informed trading decisions.
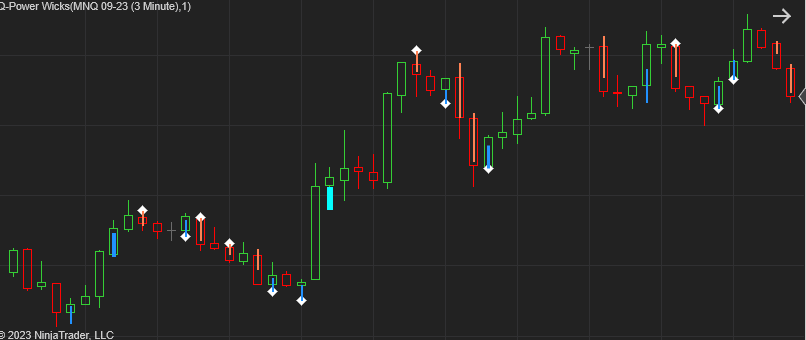
Power Wicks, our innovative indicator, provides a comprehensive analysis of buying and selling dynamics within each bar. It carefully examines market imbalances and plots a wick from the High to Low, extending to the intra-bar VWAP (Volume Weighted Average Price) whenever a significant imbalance or a shift occurs. The wick’s width varies based on the significance of the underlying data, granting you a deeper understanding of market trends.

The width of the wick shows how significant the buy sell imbalance is. The wider the more significant.

The Blue wicks shows that the Buyers are dominating the Sellers. The wick extends from the Low to the intra-bar VWAP .

The Orange wicks shows that the Sellers are dominating the Buyers. The wick extends from the High to the intra-bar VWAP .

The VWAP level is handy for entries and exits.

The diamonds shows when there was a significant shift in the buy sell ratio over the past 2 bars. Shifting from buying to selling and vice versa.

Confirmation and Invalidation of Trade Ideas

By analyzing the ratio of Smart Buyers to Smart Sellers, we gain a powerful tool to confirm our trade ideas and also to invalidate others. Relying solely on price action without considering volume is comparable to trading blindly, but with Power Wicks, we can make more insightful and accurate choices.

Trading Reversion / Pullbacks

One of the indicator’s notable strengths lies in identifying pullbacks following significant price movements. Observe how the color of the wicks changes from blue to orange or vice versa, indicating a shift in market balance and signaling potential reversals.

Trading Break-Outs

Power Wicks excels in detecting false breakouts and trendline breaks. If buyers do not support an upward break or sellers do not pressure a downward break, the likelihood of a successful breakout diminishes. The confirmation from buying or selling pressure is instrumental in validating a break.

Momentum Analysis

The wicks also provide essential clues about mid-trend periods, revealing potential overbought or oversold conditions. As long as buyers or sellers continue to participate actively, the trend can persist with strength.

Testing and Results

To assess the indicator’s effectiveness, we devised a straightforward strategy. While this strategy is not intended as a standalone approach, it helped us gauge the value of Power Wicks in enhancing our trading ideas.

Test Results:

Our strategy involves executing buy orders when a Diamond pattern appears at the price low and sell orders when a Diamond emerges at the price high, and the price moves in our anticipated direction. These Diamond patterns are based on shifts in the behavior of Buyers and Sellers.

It’s essential to note that this strategy is not meant to be a fully-fledged trading approach.

In conclusion, Power Wicks’ analysis of Smart Buyers and Smart Sellers intra-bar dynamics empowers traders to better comprehend market movements. The indicator’s ability to confirm and invalidate trade ideas, identify pullbacks and breakouts, and assess momentum provides a robust foundation for more successful trading strategies. When integrated with other effective trading methodologies, Power Wicks enhances the precision and reliability of your trades, contributing to your overall trading success.

$295.00

MORE PRODUCTS YOU MAY LIKE

We pick out some of our products

Q-DNA

We named this indicator Q-DNA as it aims to delve in to the DNA of the market by “sequencing” volume , price and time. It then compares and measures the relationship between the three to give us accurate measures for volatility, trend changes, support, resistance, divergence between volume and price, over-bought-oversold areas and Double Bottom […]
$295.00

Q-Dynamic Ranges NT8

    Free Download

Q-BetterBollinger NT8

Bollinger Bands is an effective and very popular indicator based on a moving average and a volatility measure above and below the average. Indicators based on moving averages generally suffers from tardiness. Being slow does not help anyone get anywhere fast, especially our trading success. Our Better-Bollinger Indicator succeeds in this goal by replacing the […]
ADDED TO CART