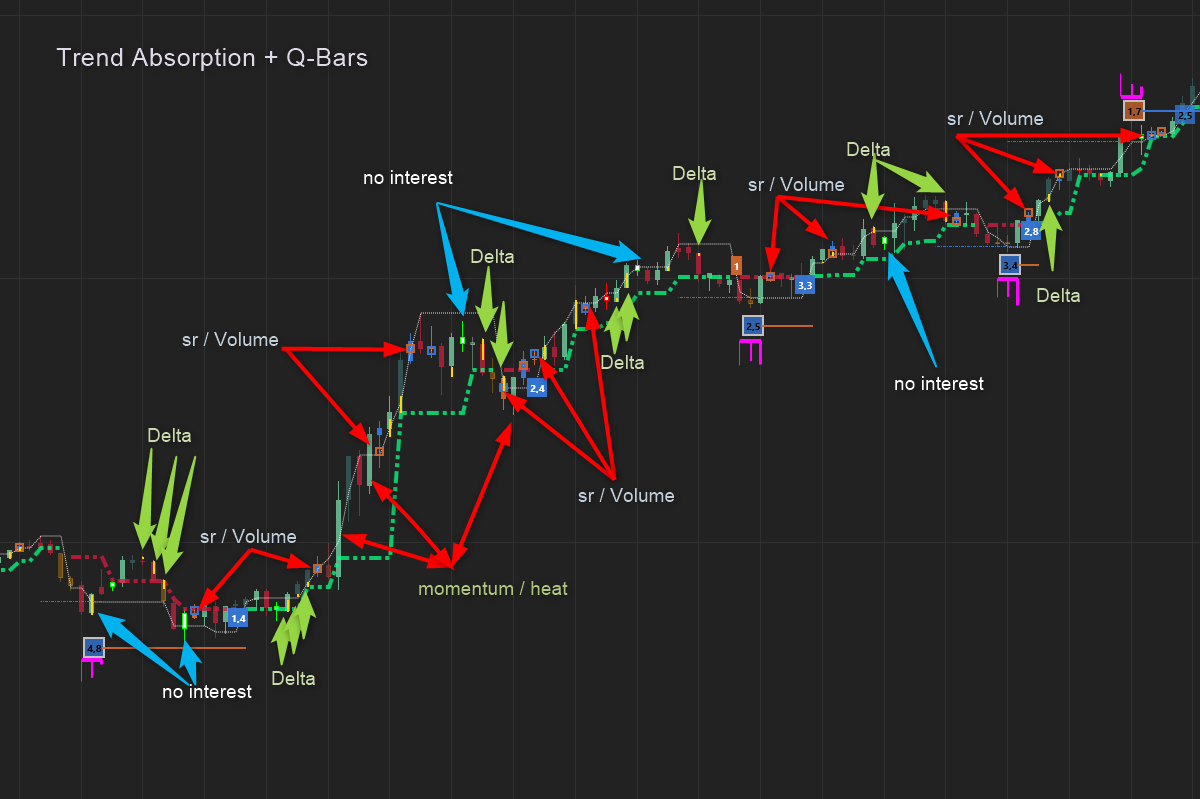
Trend Absorption
This indicator starts with detecting the current trend as efficiently as possible utilizing past and current support and resistance levels. It detects the trend changes as fast as possible with the least amount of noise . It then looks at the volume, volatility and delta inside the trend to determine the point when the selling or buying is absorbed and the scales tips in the opposite direction. This makes the trend change signals faster and more accurate
Key Features
Trends and Trailing Support and Resistance
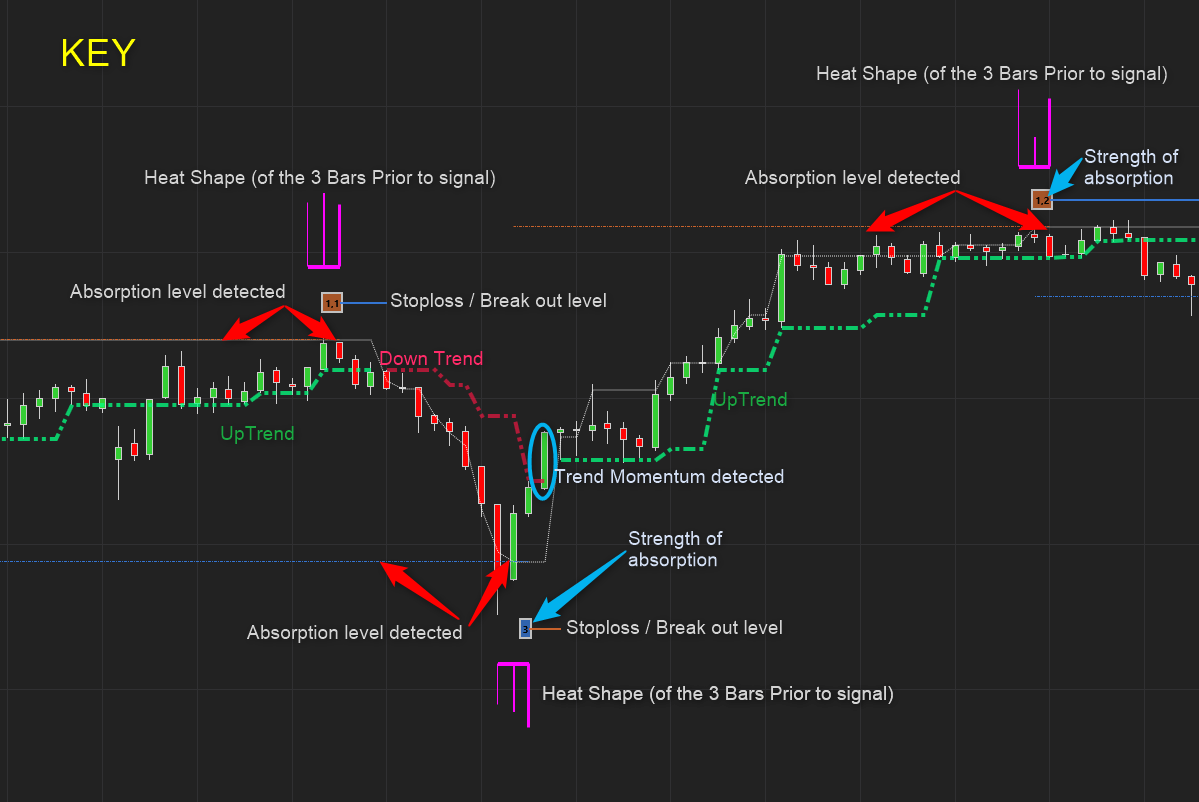
Trends are determined along with trailing levels that acts as good proxies for trailing stoplosses. These trend changes make for good signals but we found it can be improved upon greatly by looking at the information regarding the volume , delta and volatility inside every trend,
Reversal Levels / Points
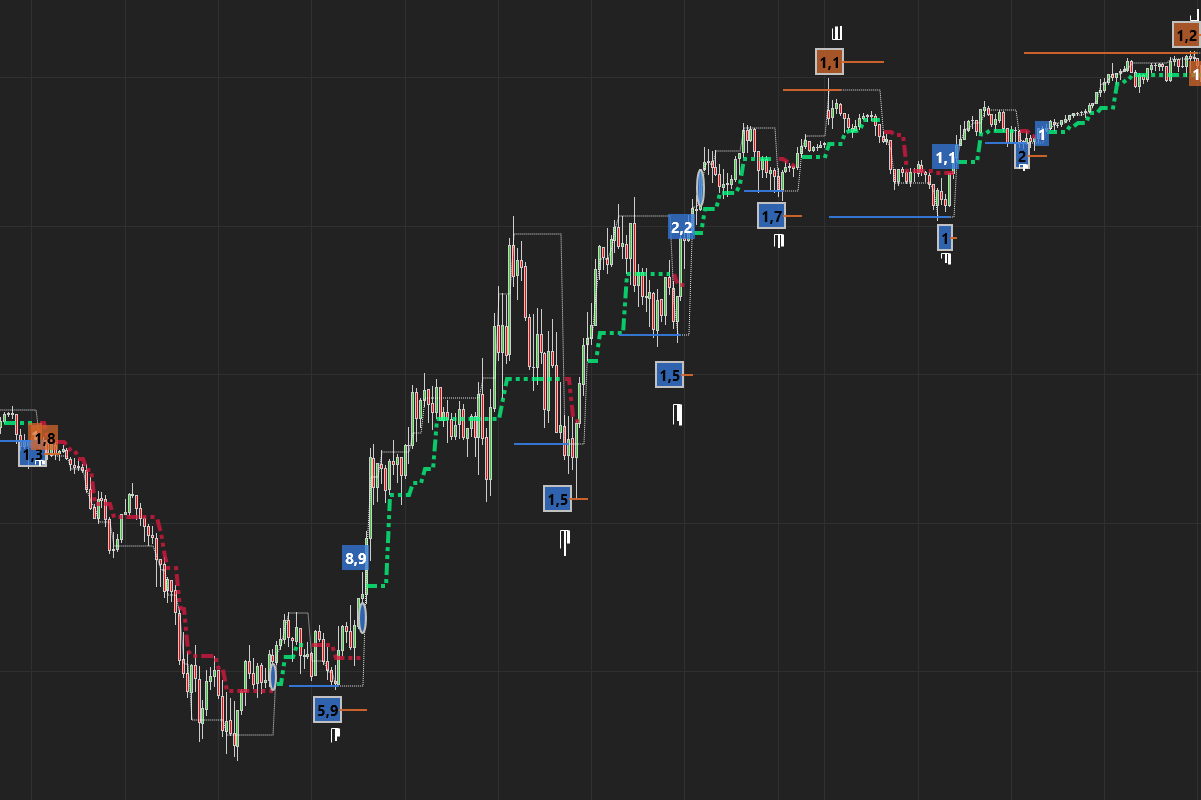
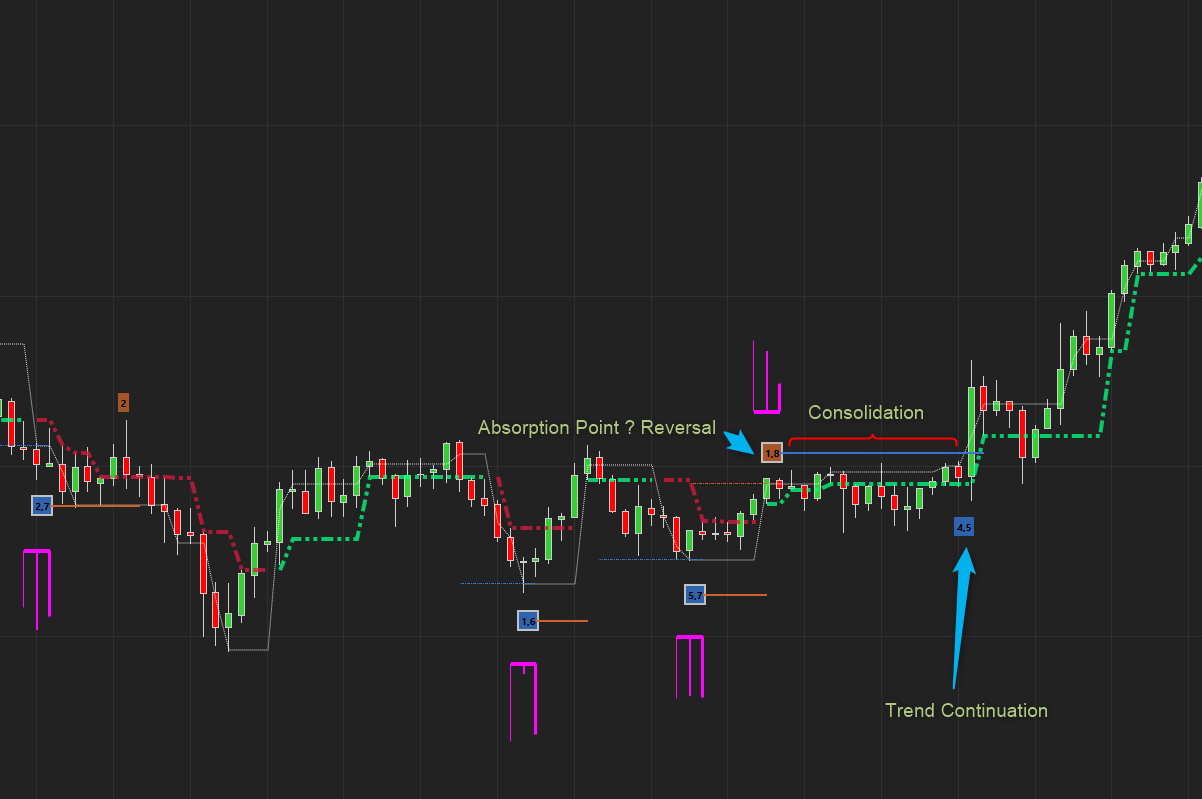
The reversal points aims to find the level inside each trend movement where the balance of the buying and selling behavior shifts significantly to the opposite direction. This is the point where the buying / selling is absorbed
Once this point is determined, the indicator find and plots the absorption level.
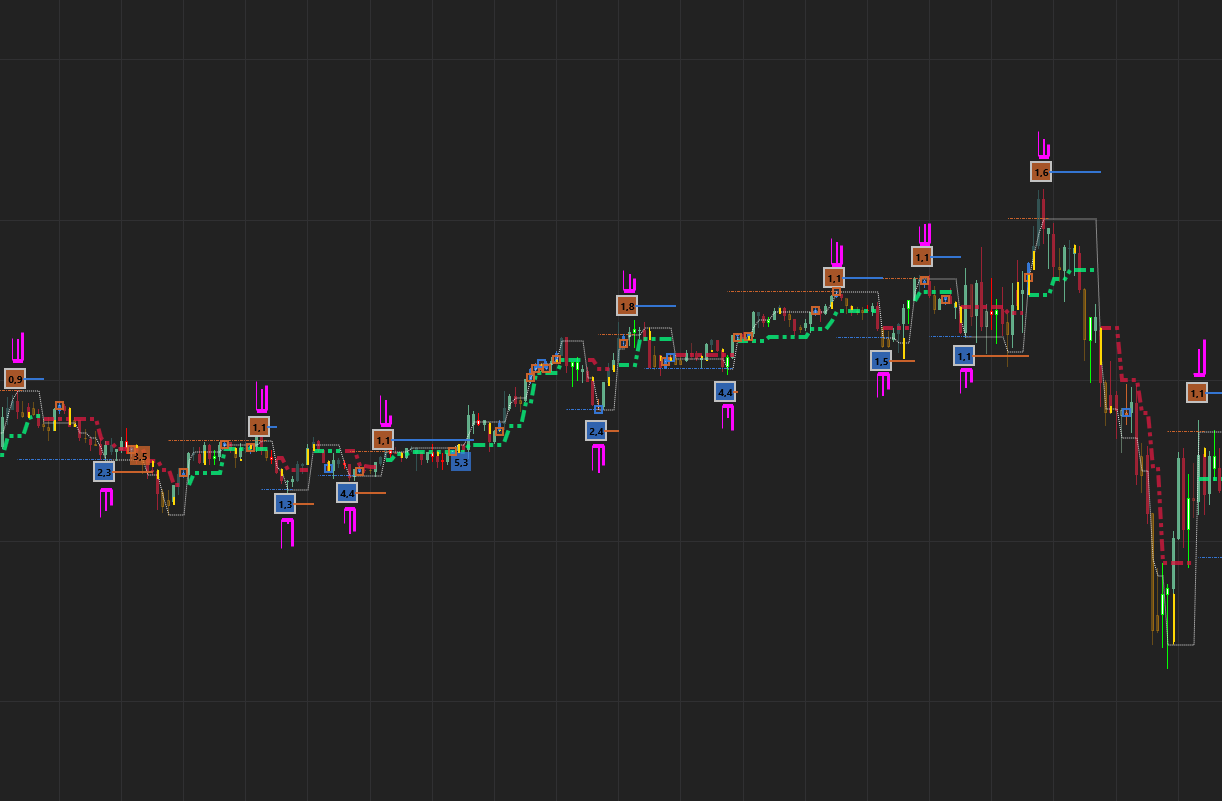
It also plots a label showing the “strength” of this level. The strength is simply the value of the absorption compared to previous similar levels.
This label is plotted below the absorption level (Long reversals) and above the absorption level ( Short reversals) by a user defined amount in ATR`s.
This level acts as a stoploss level or a break-out / trend continuation level. Read more on this below
Break – Outs / Break of Structure / Continuations
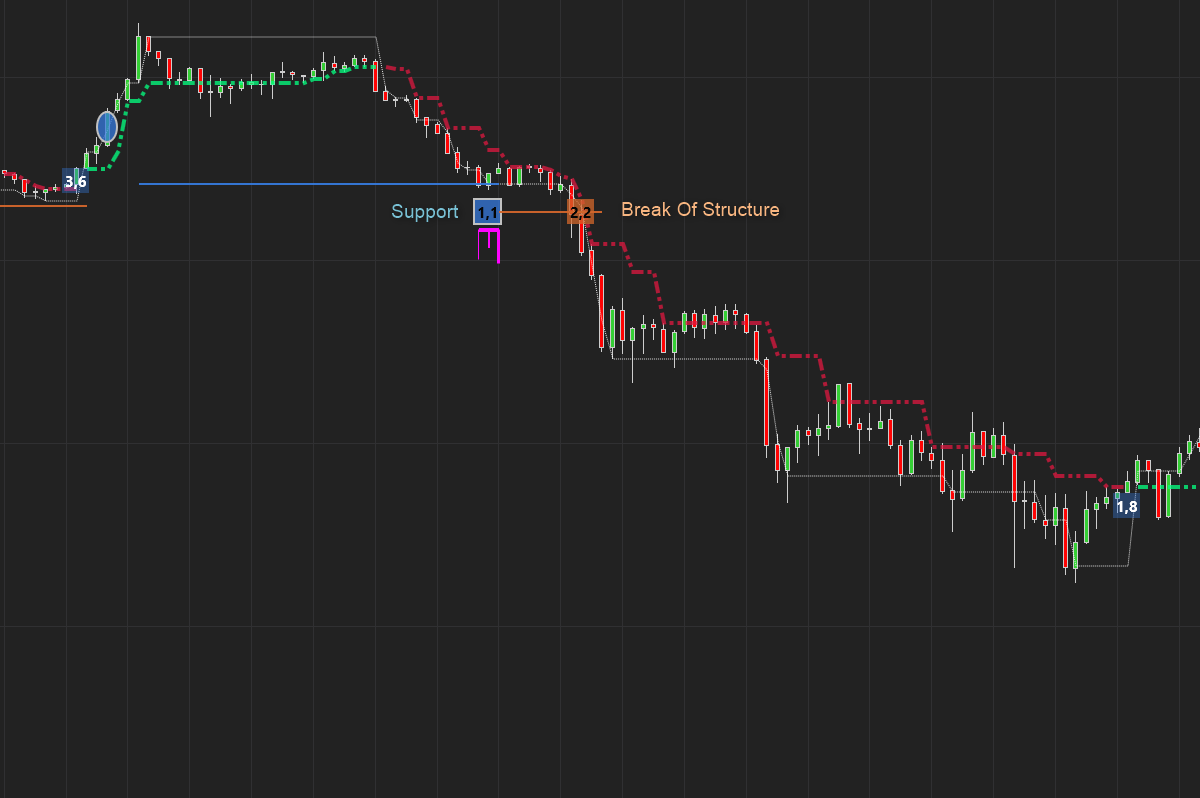
Not all reversal levels hold, often the market will consolidate around this level only to break in the direction of the trend. These breaks or continuations often lead to powerful moves.
Momentum
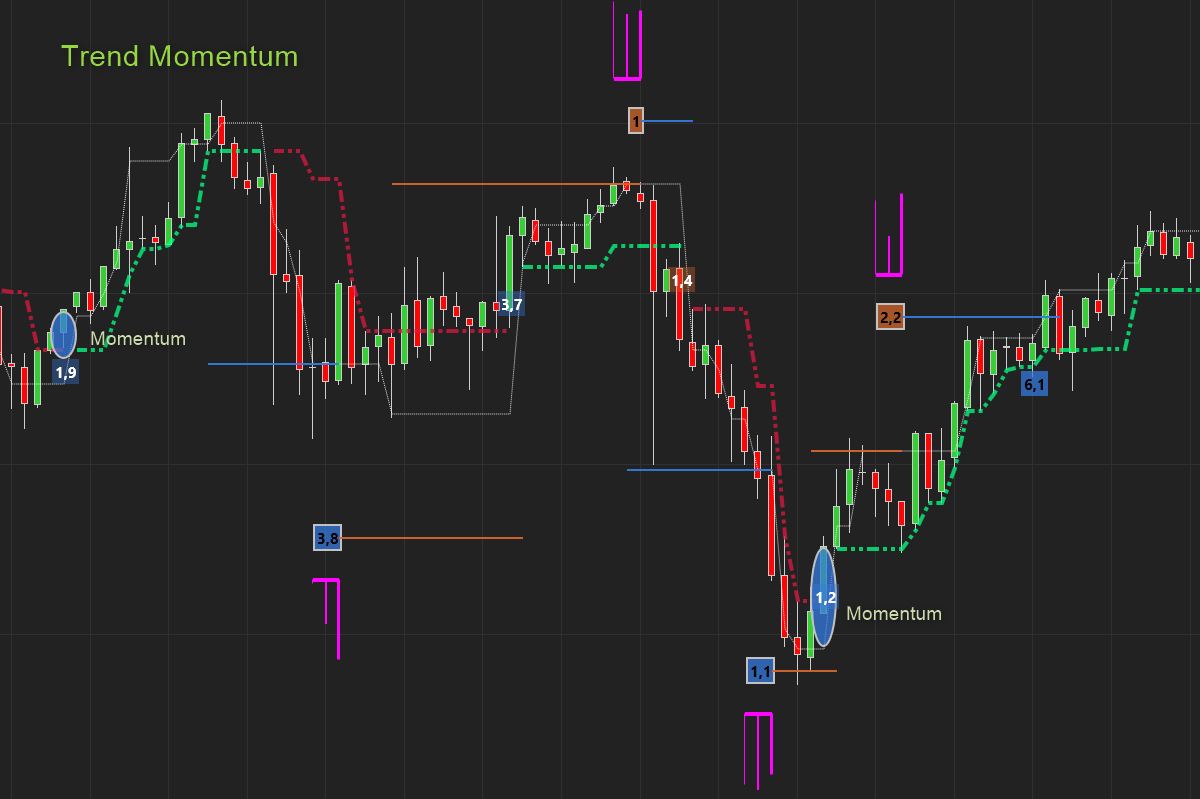
The Trend Momentum ellipses are basically the opposite of the absorption Reversals signals. They signify when the buying (uptrend) is not significantly challenged by selling volume or the selling (downtrend) is not significantly challenged by buying volume. No absorption , Momentum.
These signals work best at the start of the trend. When they appear at a very late stage in a trend it shows exhaustion and it is likely the end of the trend.
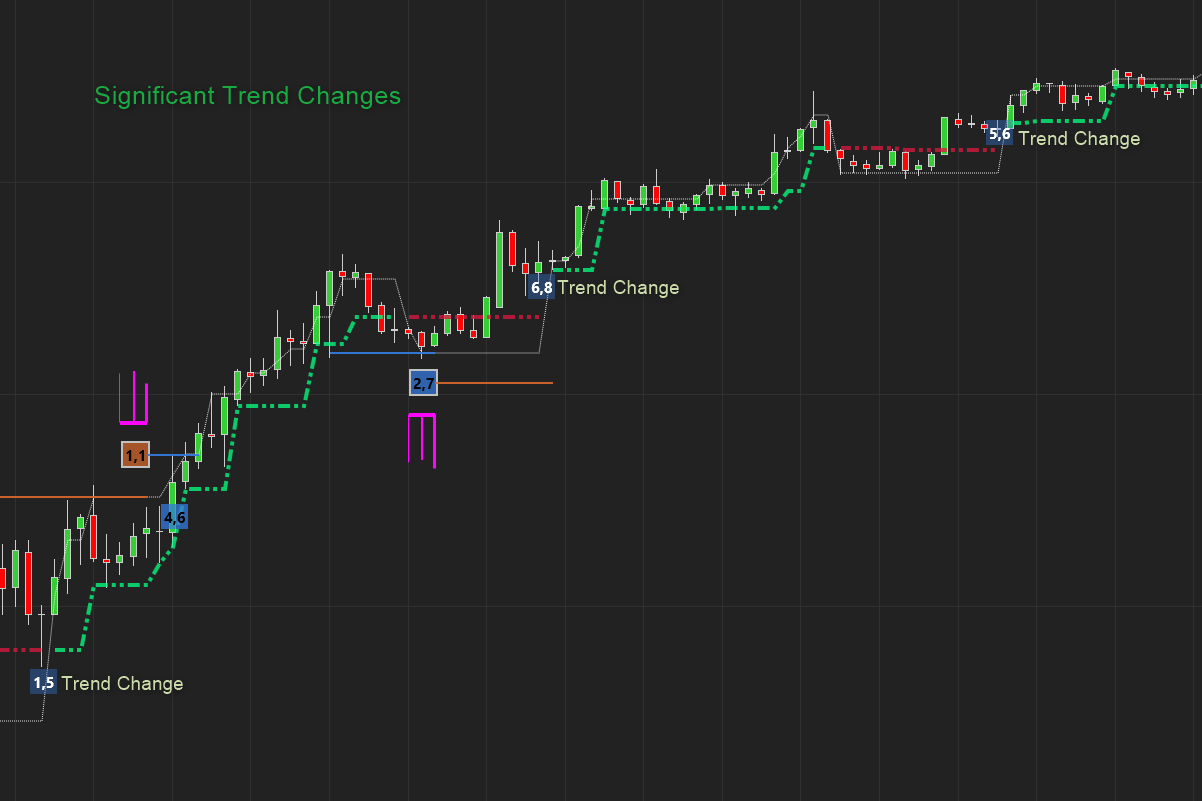
The Significant trend change signal is produced when the trend change is accompanied by very significant relative buying to selling pressure
Filters
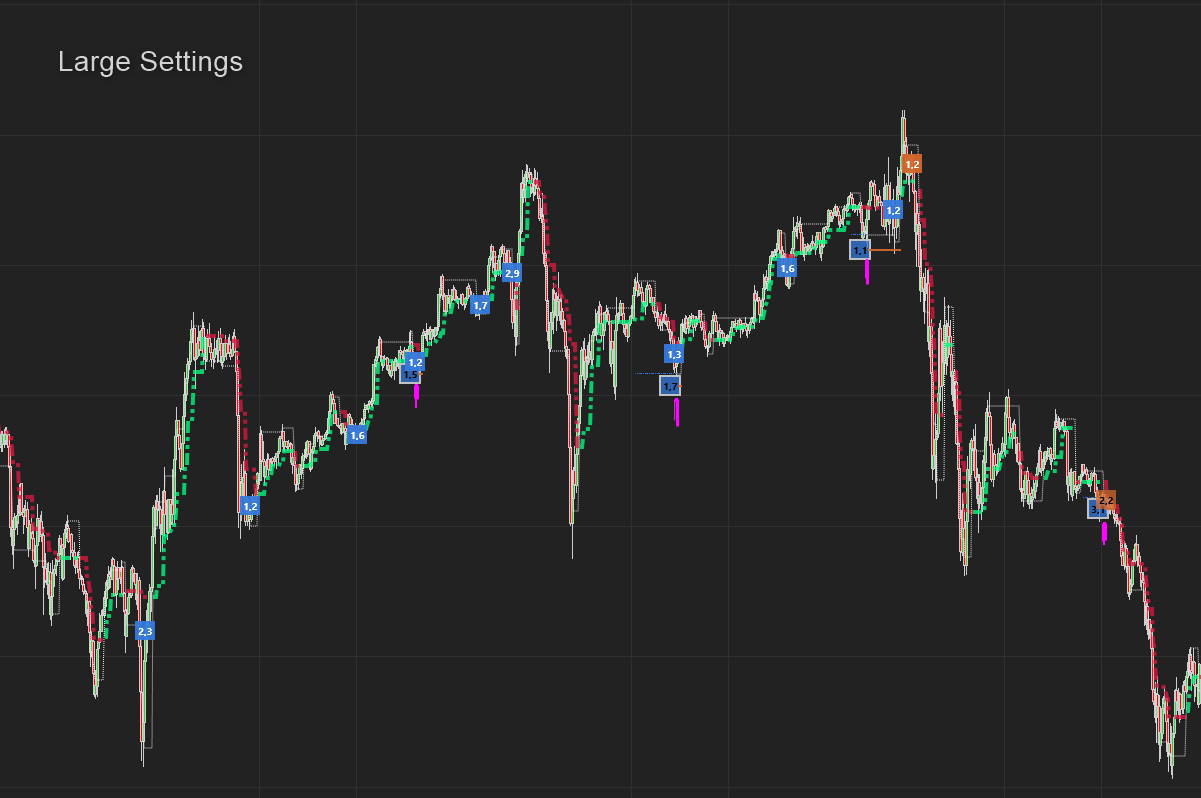
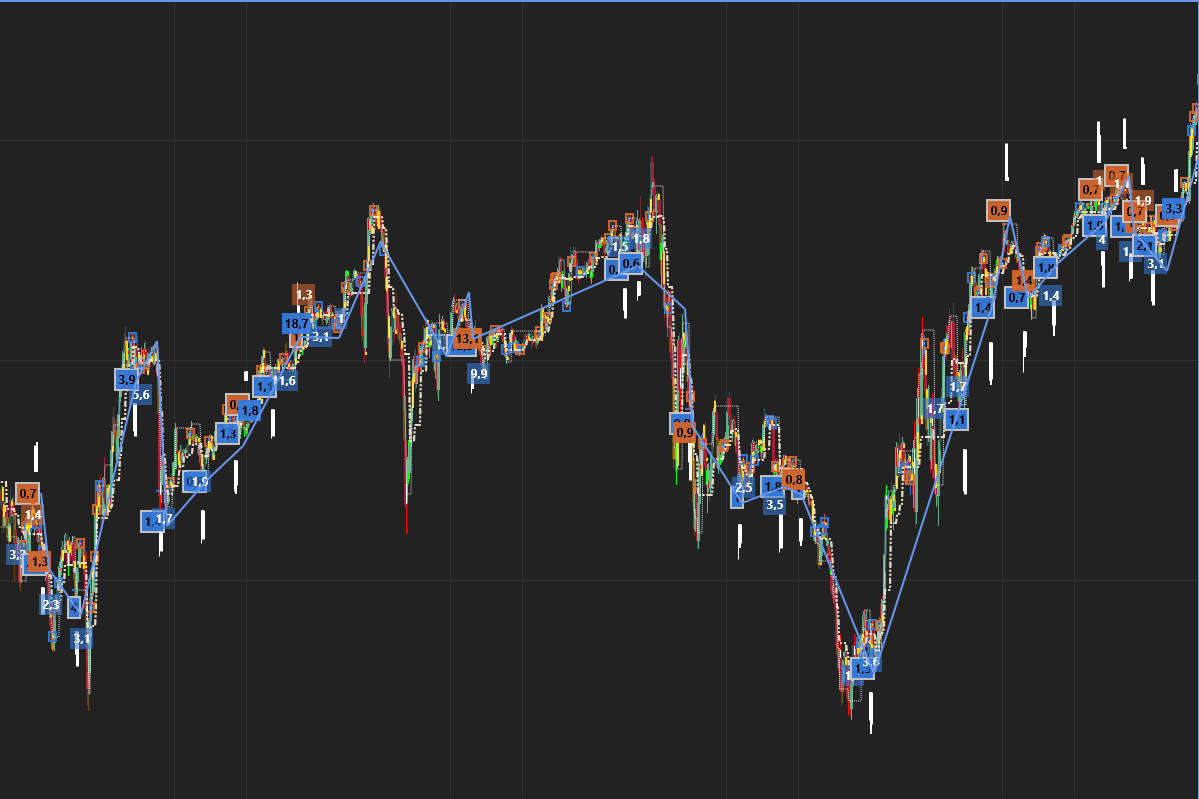
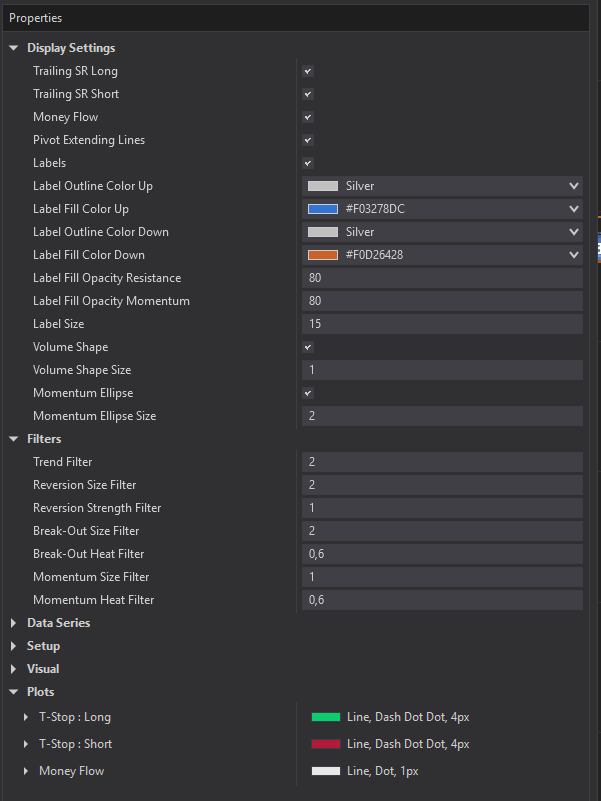
This indicator has a host of different setting to fine tune it to your trading style and instruments traded. The default settings work well all round but you are welcome to customize it to your own preferences.
In the image above we have set the settings quite large which produces fewer signals but perhaps more significant signals
Putting it all together
Settings
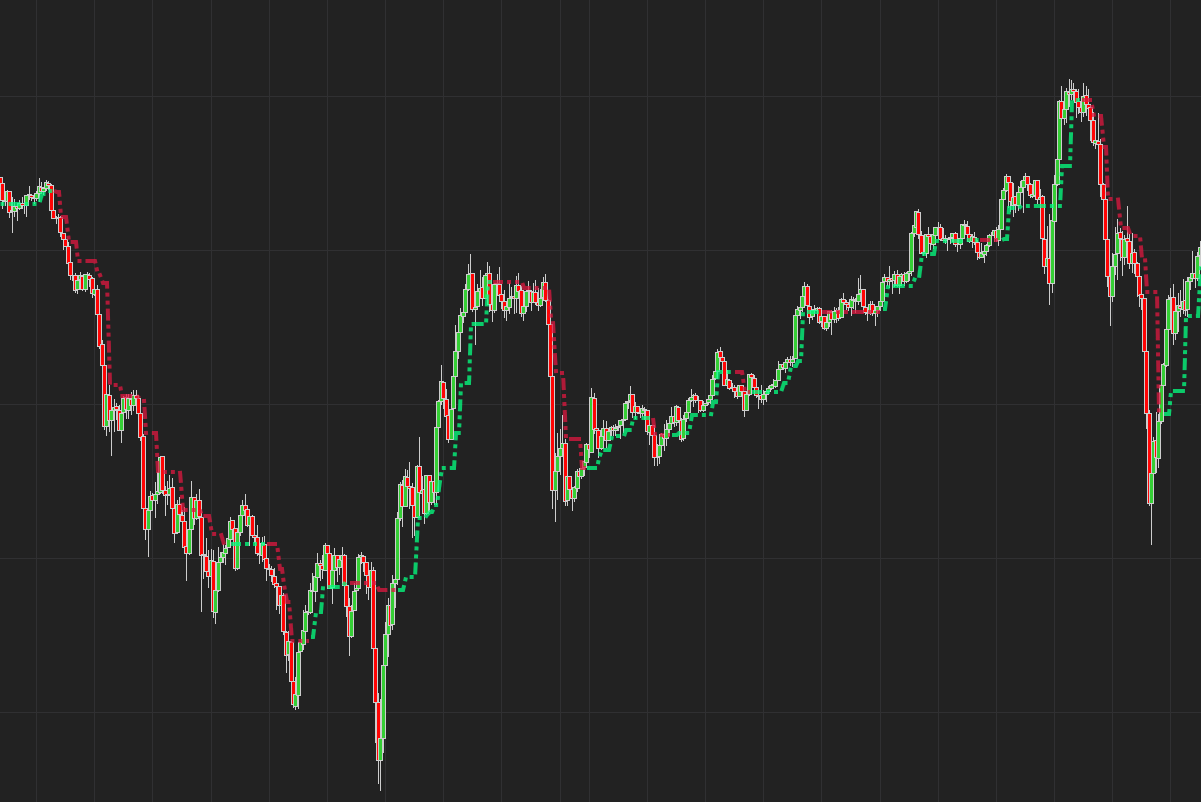
Heat Bars + Trend Absorption Combo

Trend Absorption uses the information from Q-Bars to calculate most of its variables. Q-Bars shows the micro picture and Trend Absorption the macro picture. The one predicts the other. We have created a Lite version of Q-Bars with all the power but less of the drawing and plots to really compliment this indie. The two really work well together. You can read more about Q-Bars here : https://quaderr.com/q-bars
All the plots and drawing objects can be customized for color / design and size.
Works well on All instruments and time frames
Get yours now!
has been added to your cart!
have been added to your cart!