Q-Volume NT8
Q-Volume is a Free Indicator for Ninjatrader users.
Q – Volume for NT8
Volume is one of the best forecasters of price movements.
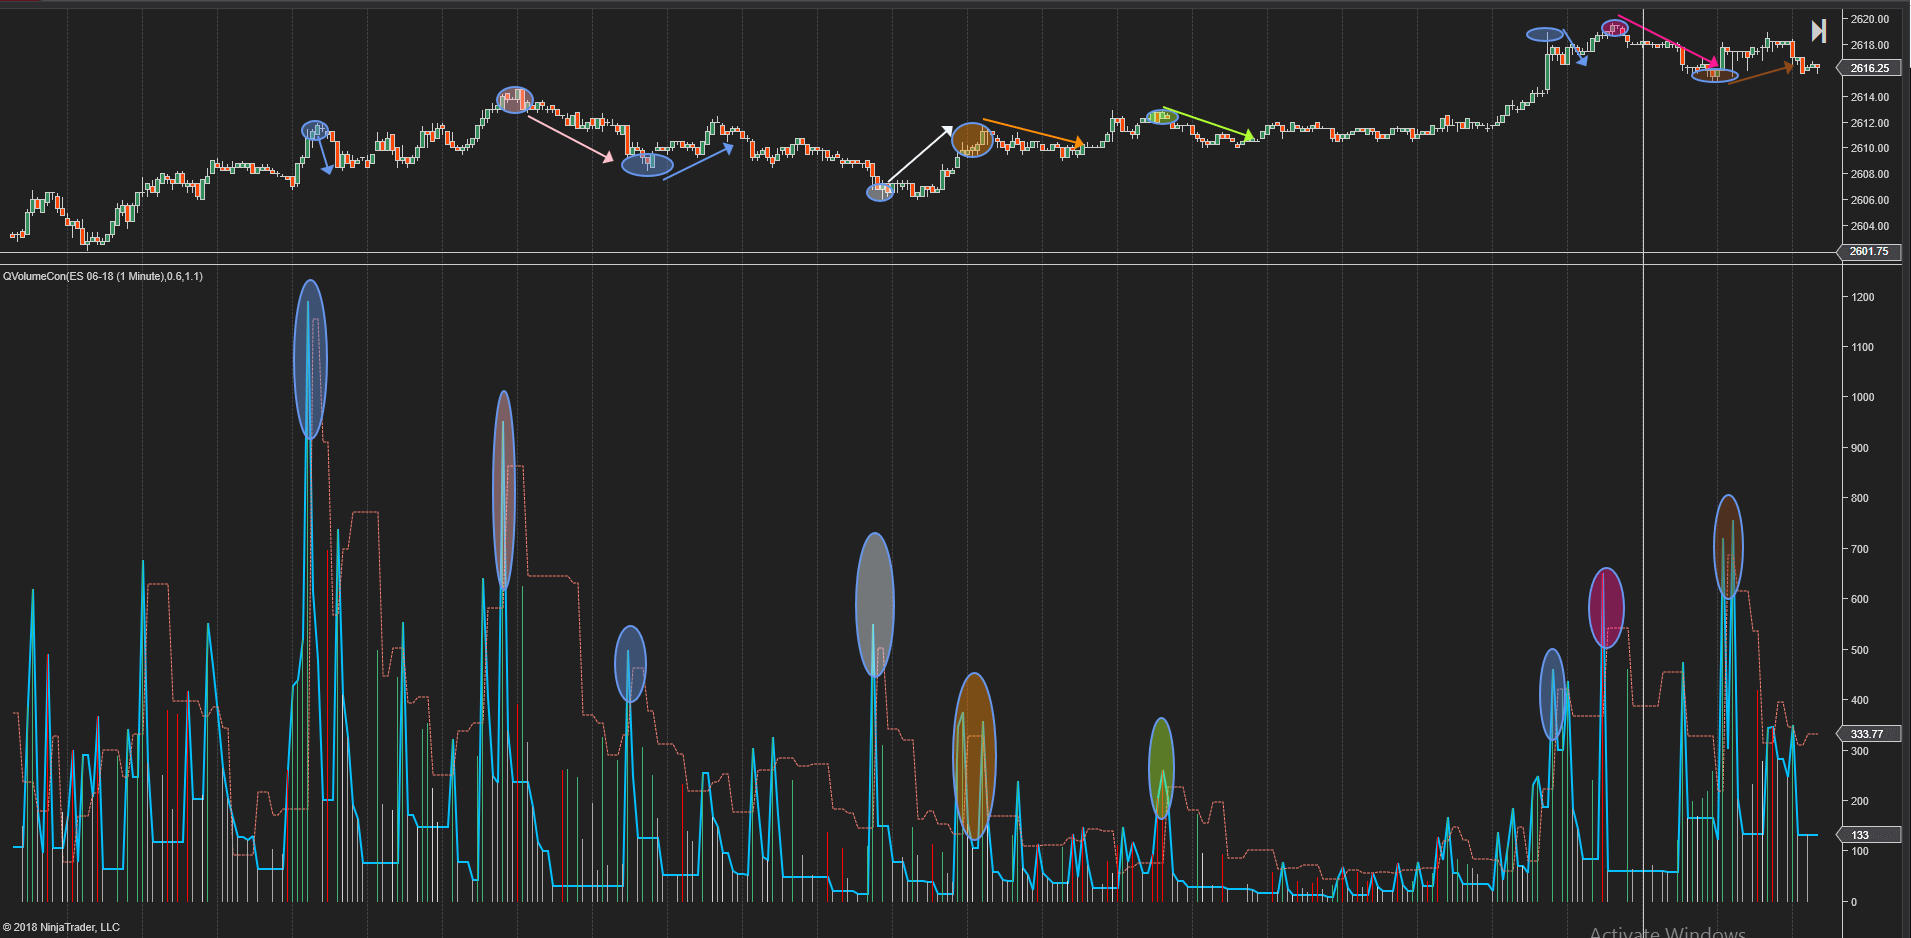
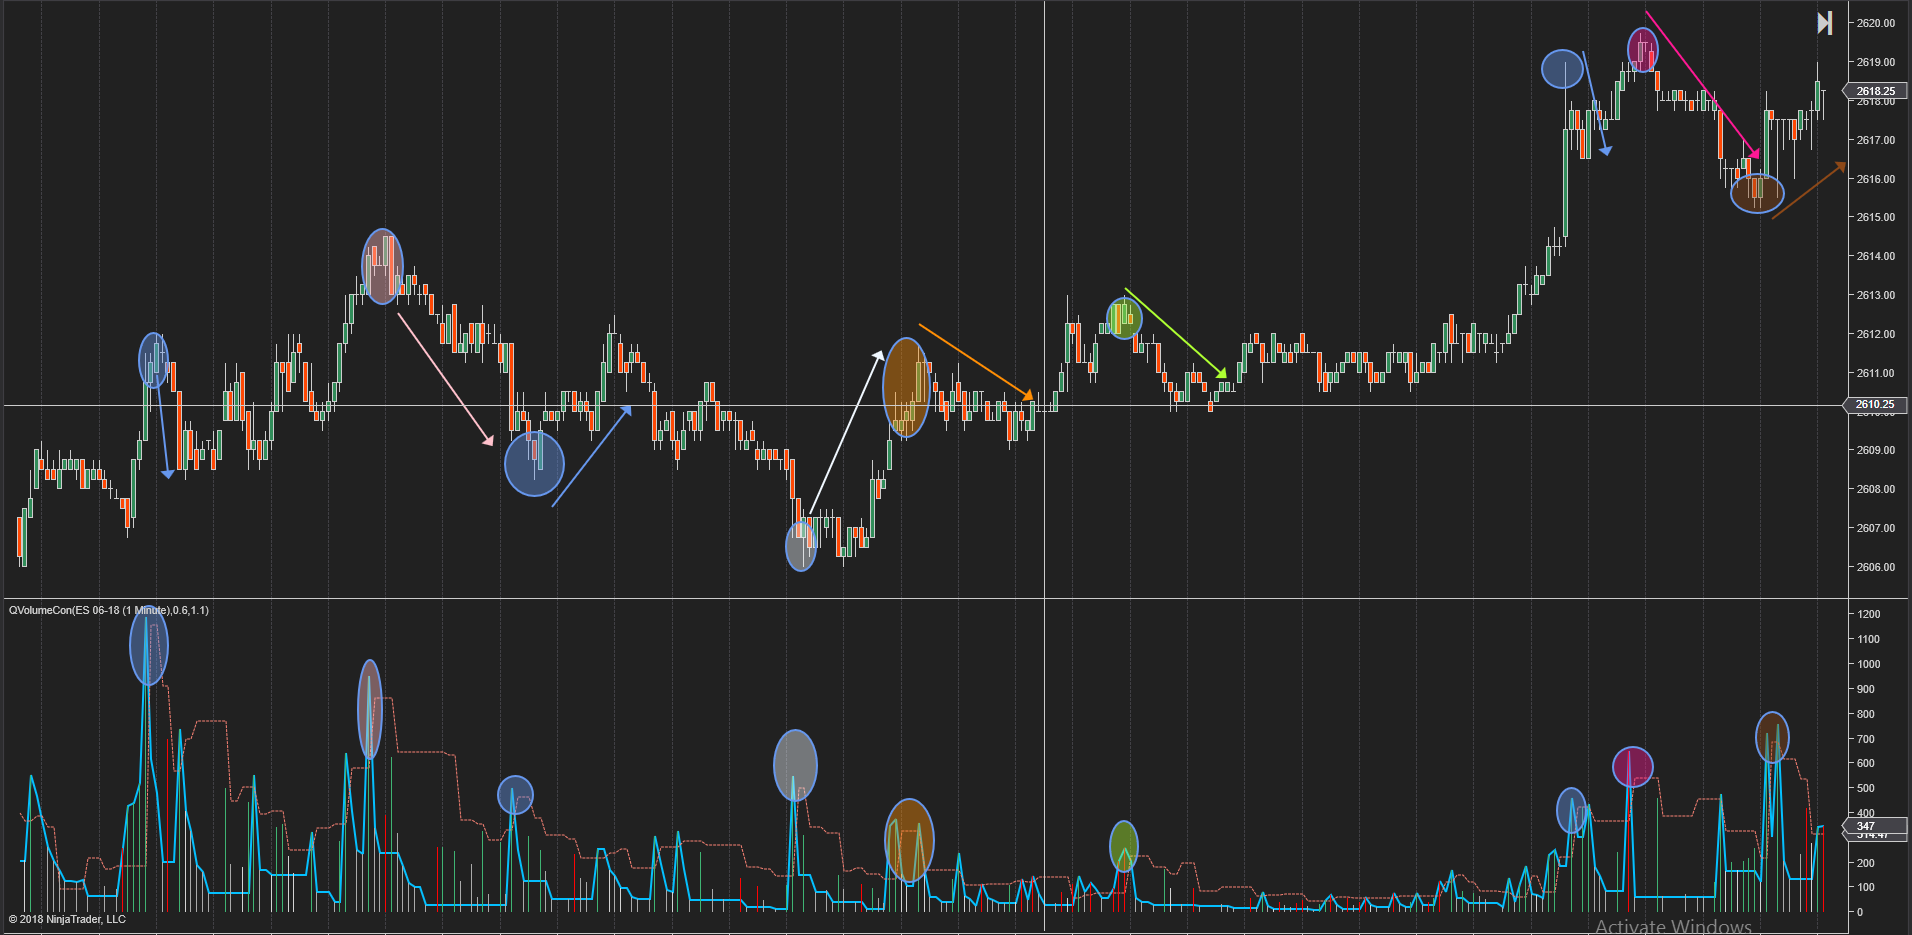
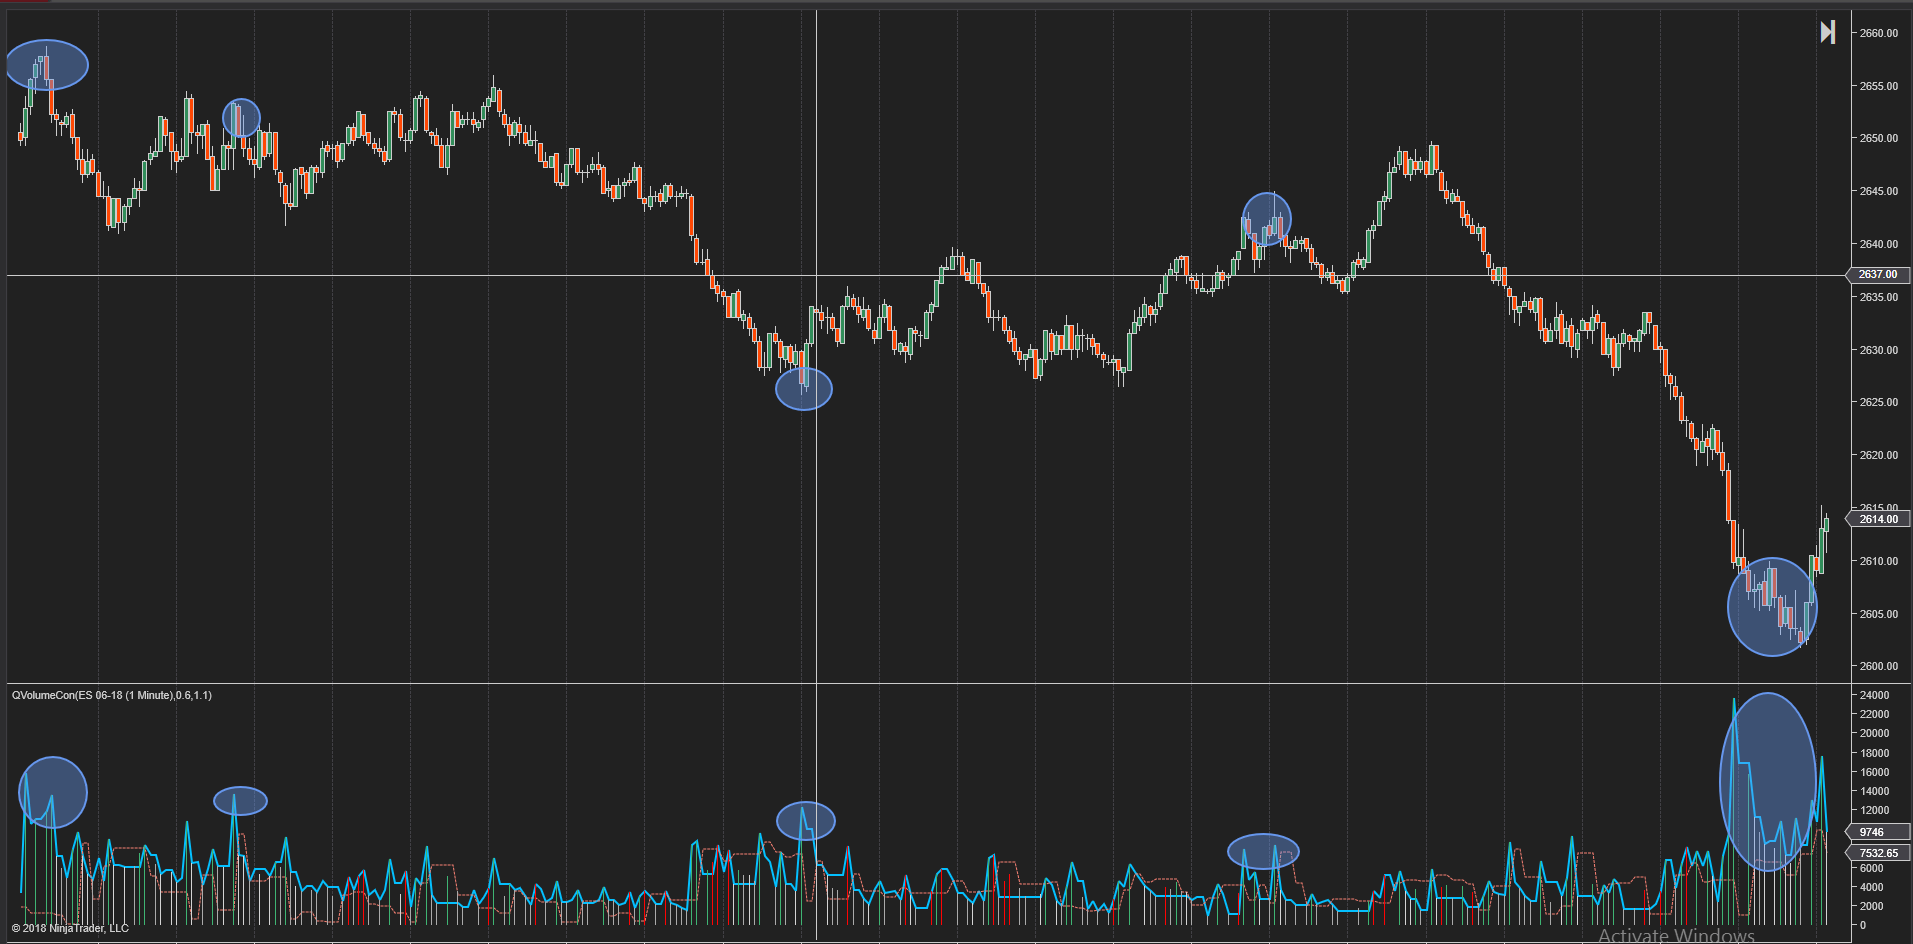
Large and steep price moves coupled with increased and significant volume at the end of the move signals a very likely reversal point and at the very least a new significant support or resistance level.
Q-Volume filters the volume to determine what volume is significant and plots this.
It also changes the color of the volume bars according to:
- Larger moves on significant volume – Green;
- Small moves on significant volume – Red
- Insignificant volume and volatility – White
- a Lot of consecutive Green Bars followed by Red signals a very likely reversal.
- a Lot of consecutive Red Bars signals a strong support / resistance level.
- Generally , if the blue (significant – filtered – volume) plot exceeds its Volatility forecast coupled with 1 or 2 above, we can expect a significant price move.
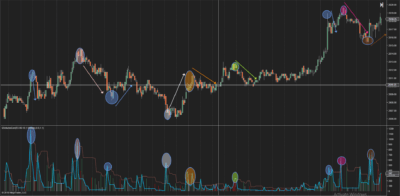
Please see the attached image for more.
has been added to your cart!
have been added to your cart!