This Indicator uses our Q-TSL indicator to plot a TSL level when you have a position.
Learn how Q-TSL plots works
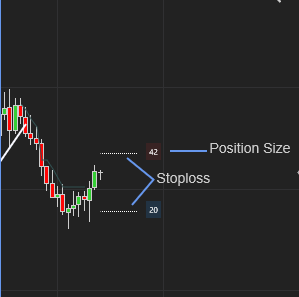
Whilst your account has no position it will only plot the initial stoploss levels along with the position size. In other words it will keep your charts clean from clutter and only give you the required information when you have an actual position. You can read more about Q-TSL towards the bottom of this page.
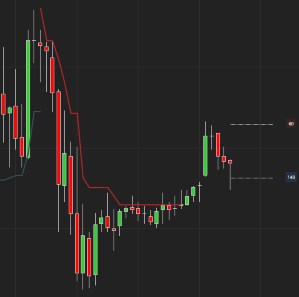
Q-TSL Plots in Action
How it works
- The Ninjatrader indicator will plot two parallel lines indicating the suggested initial stoploss levels along with the position size to be traded. You can select to plot nothing here should you wish.
- You have to select your account in the dialog.
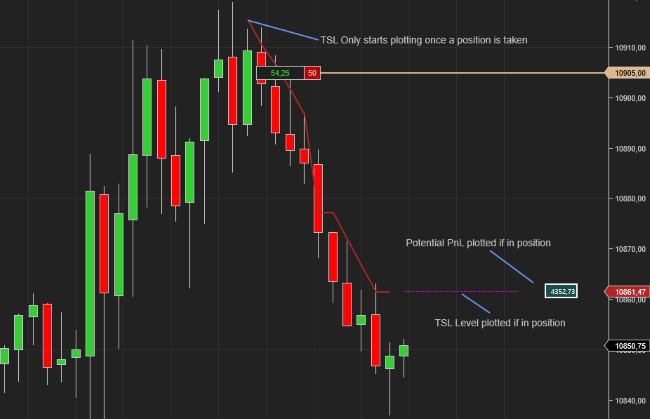
3. When you take a position, the indicator will start plotting the Trailing Stoploss along with your trade. With a short trade it will move the TSL down with the market until your position has been exited or the price closes above the TSL plot. The opposite for long positions.
4. It will also calculate and plot your potential profit or loss based on the TSL level. In other words, how much will you make with this position should the TSL be breached.
Alerts
This indicator also have alerts that will ‘Say” what you need it to speak when a trailing stoploss level is broken.