Quaderr VWAP
VWAP is a well known indicator and should form part of all Trader`s toolboxes. We have developed this indicator to cover most VWAP information needs.
This 100% Free tool for NinjaTrader 8 offers many and very customizable features.
Main Features
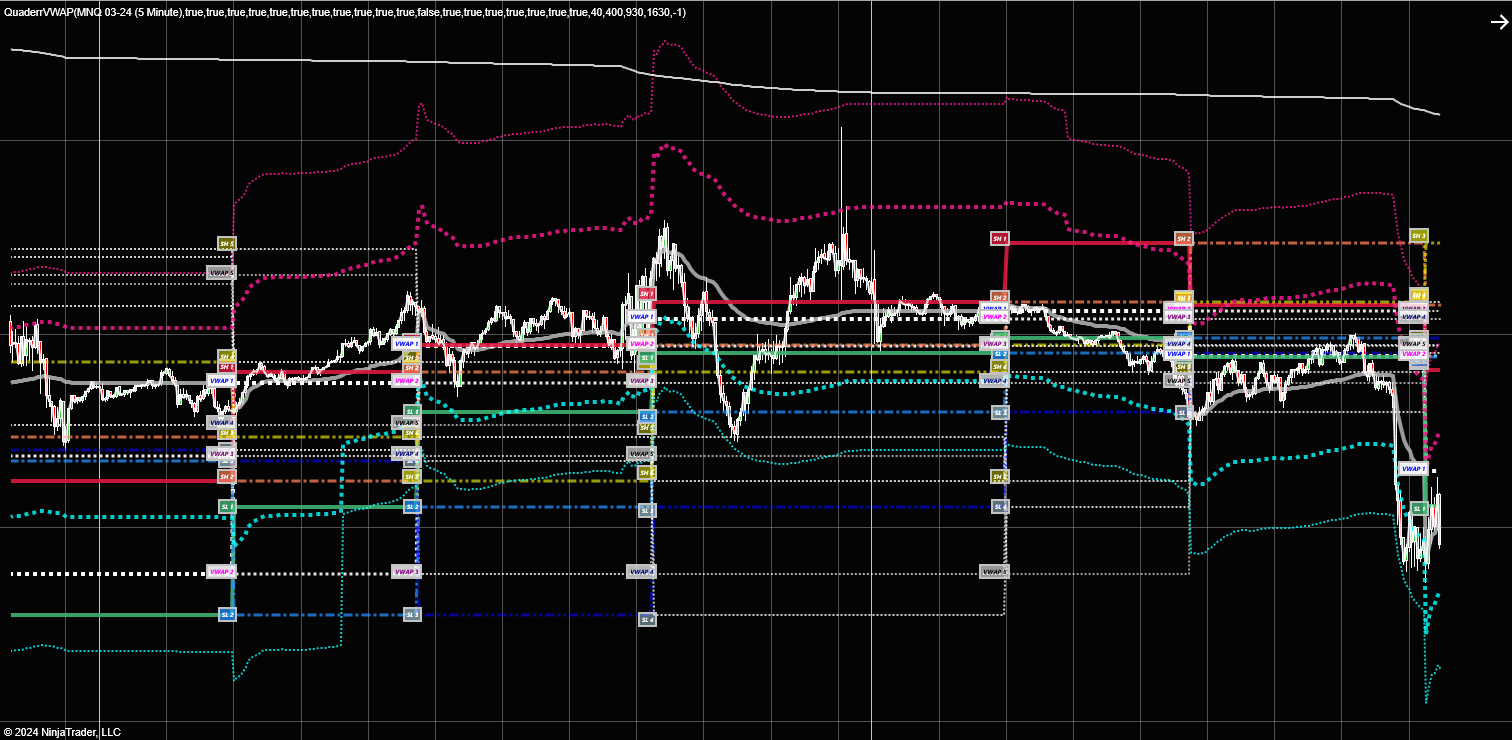
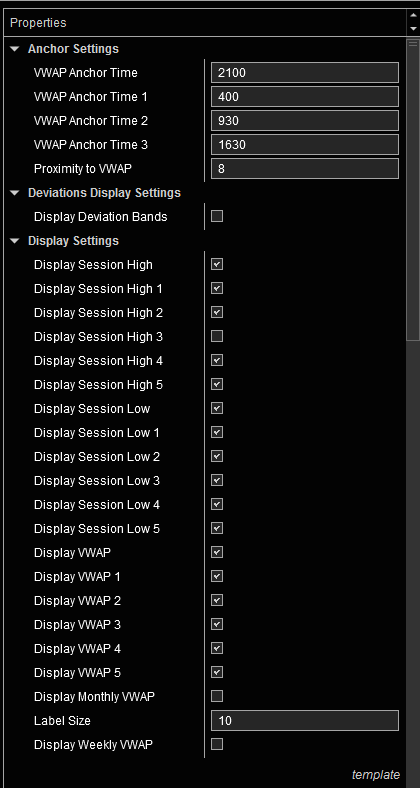
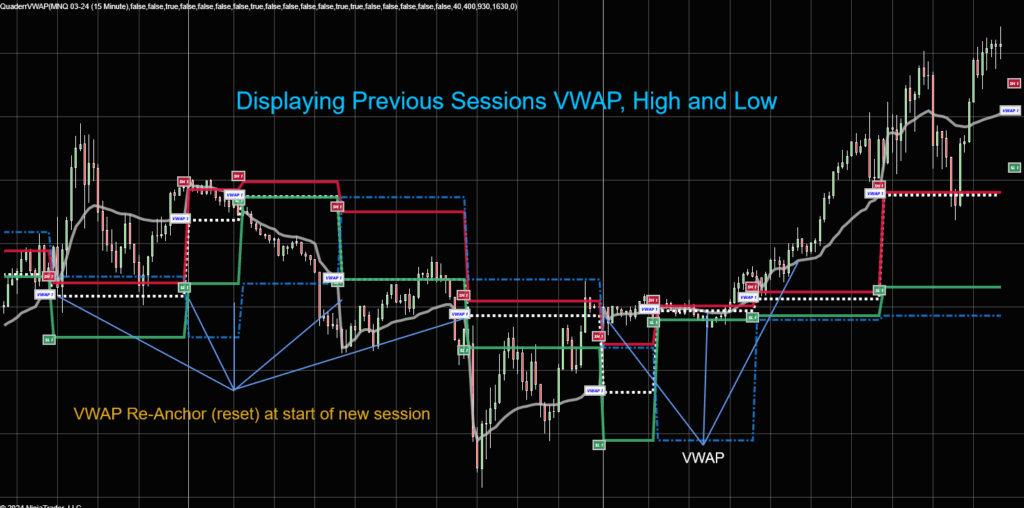
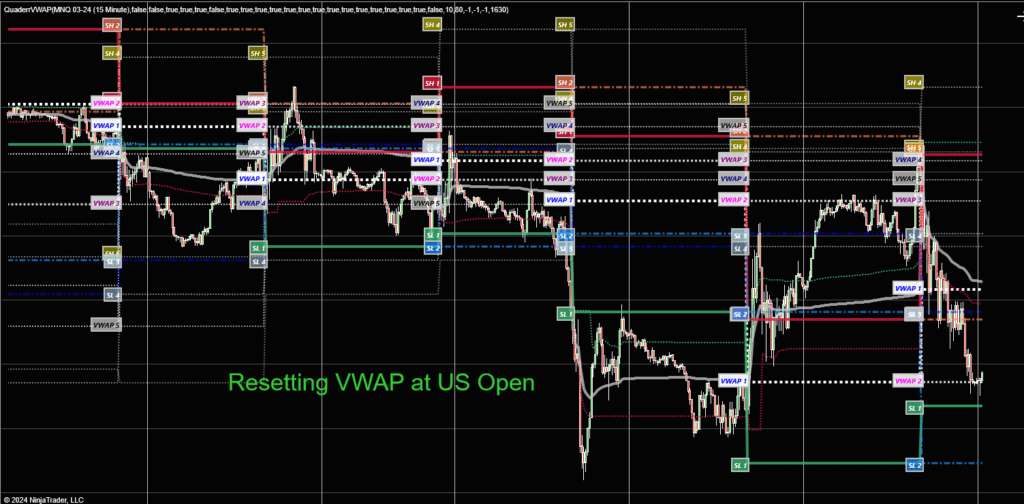
- Re-Anchor ( reset ) the VWAP up to 4 different times. For example you can reset the VWAP at the start of every major Trading session: Eastern Markets Open, European Open and U.S. Open. or only once per session / day.
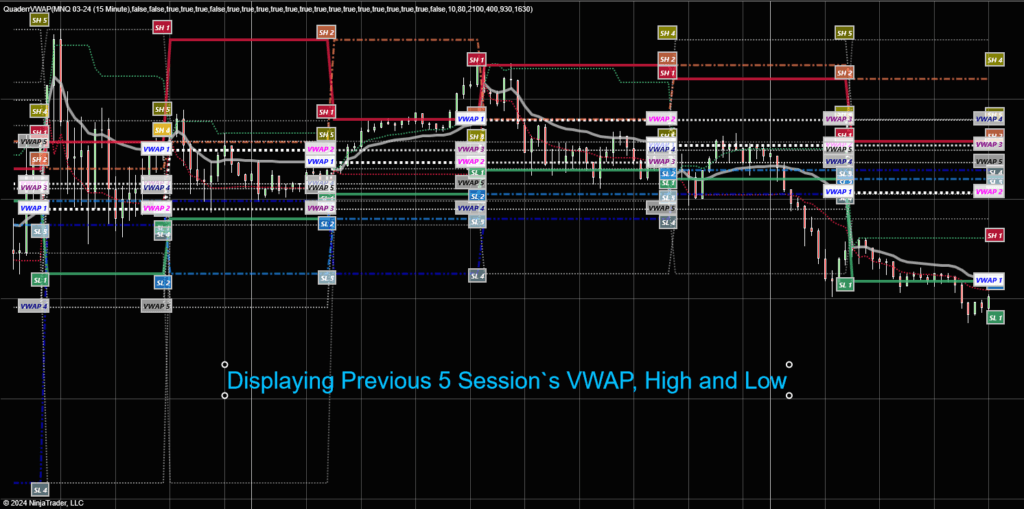
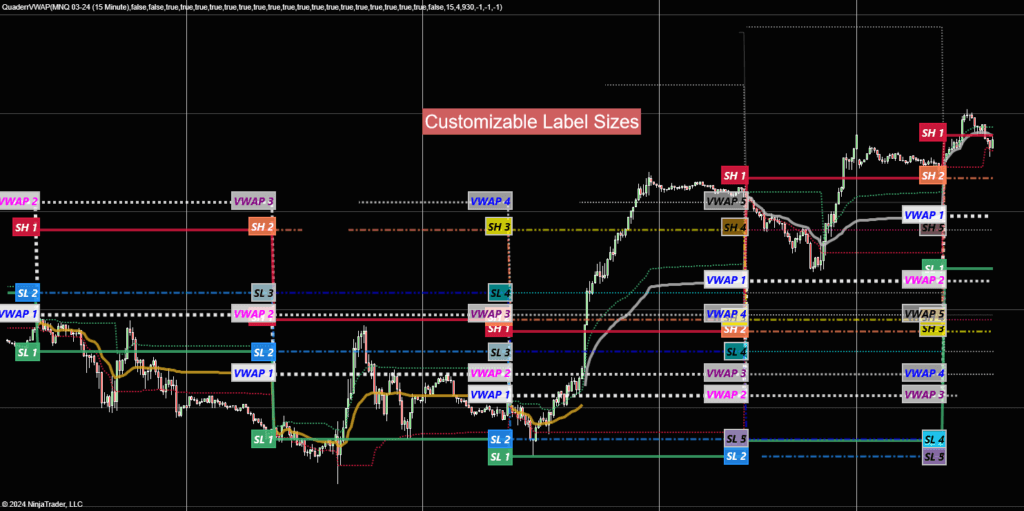
- Plot the VWAP value for up to 5 previous sessions.
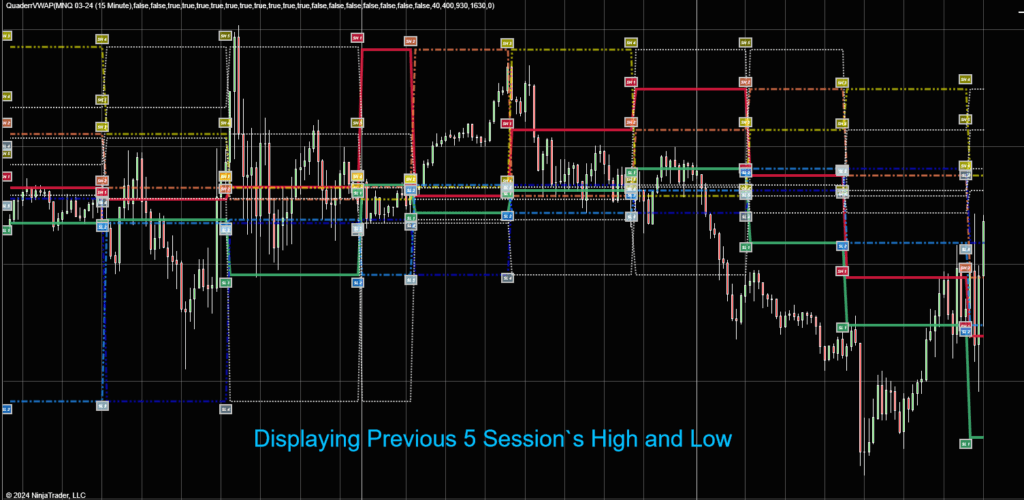
- Plot the High of the previous sessions, Up to 5 sessions.
- Plot the Low of the previous sessions, Up to 5 sessions.
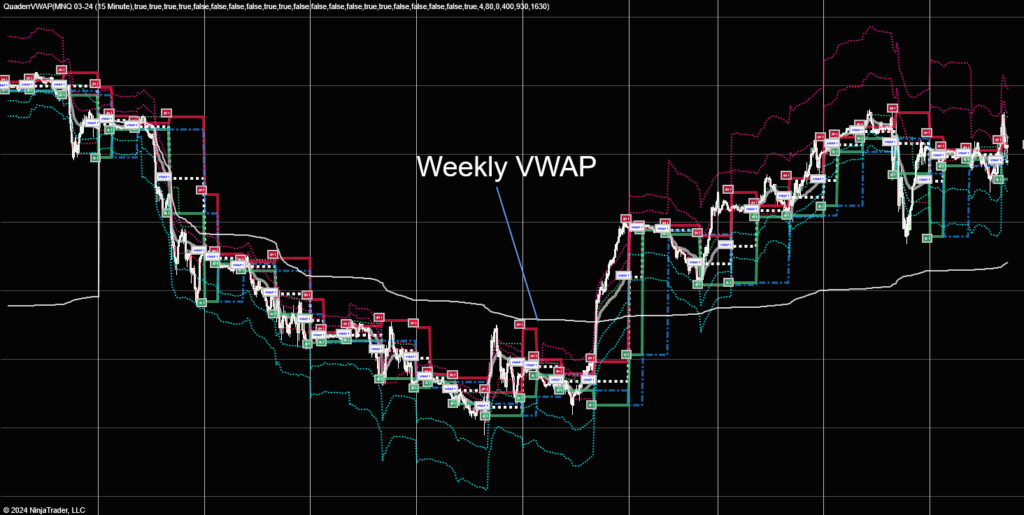
- Plot the Weekly VWAP.
- Plot the Monthly VWAP.
- Only display levels close to the current price by adjusting the proximity setting.
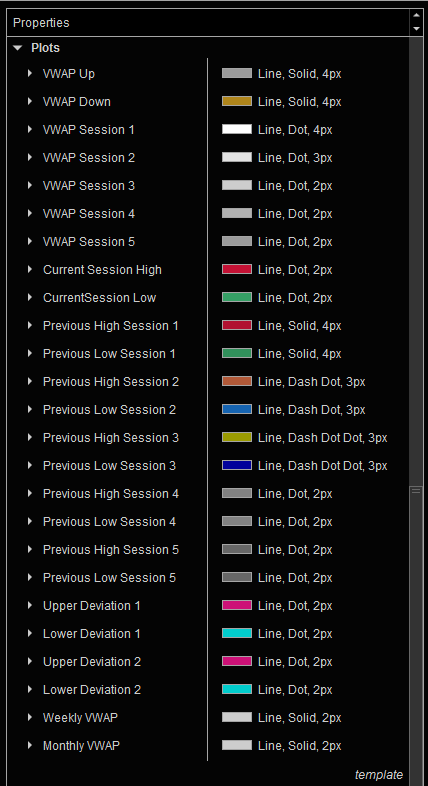
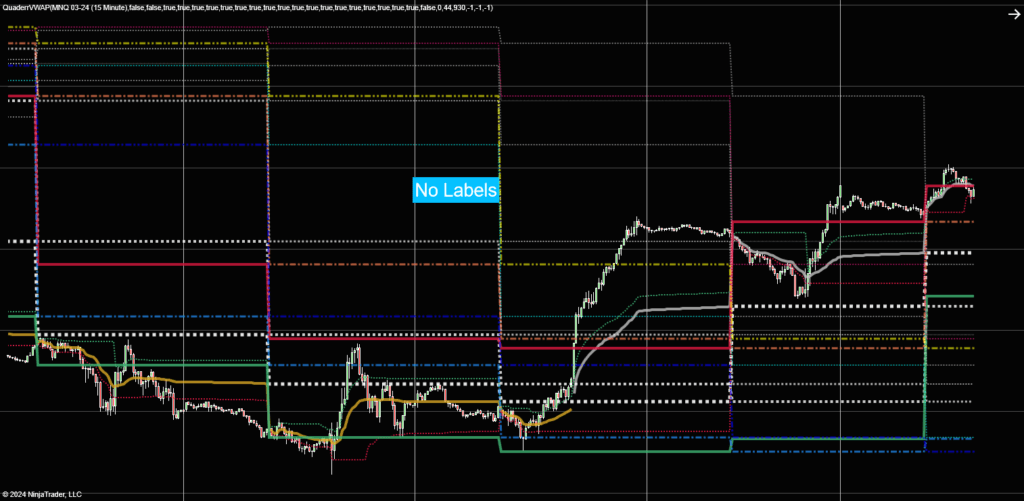
- All Plots are configurable
- Deviation bands – Similar to Bollinger Bands
- Works on all intra-day time frames.
- Works on all instruments
Displaying only the VWAP from the last 5 sessions
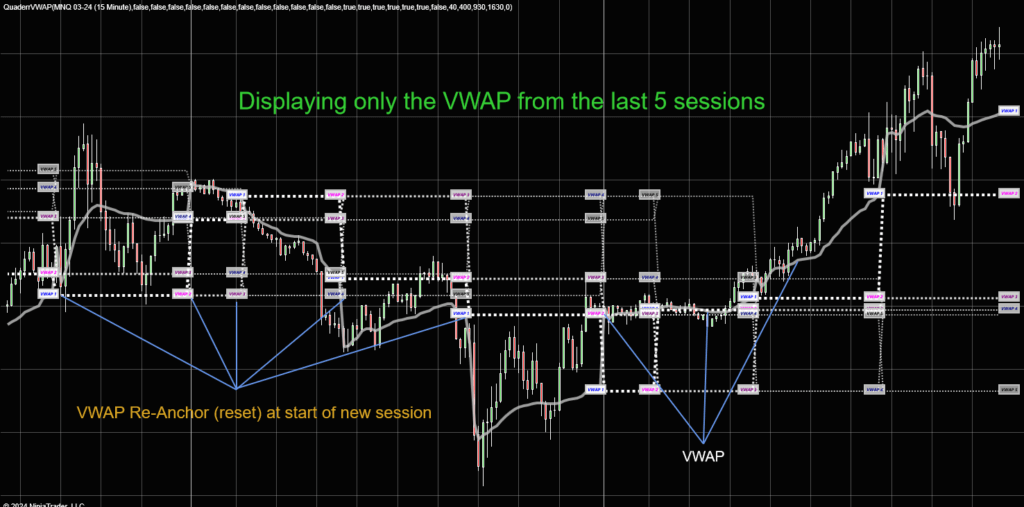
In the example above we reset ( Anchor) the VWAP at the open of every major trading session and at the close of the U.S. Session. So, it anchors when the Asian market open, again when the European markets open, when the U.S. market opens and finally when the U.S. Market closes.
This gives us a very valid VWAP curve as well as very valuable VWAP levels from previous sessions.
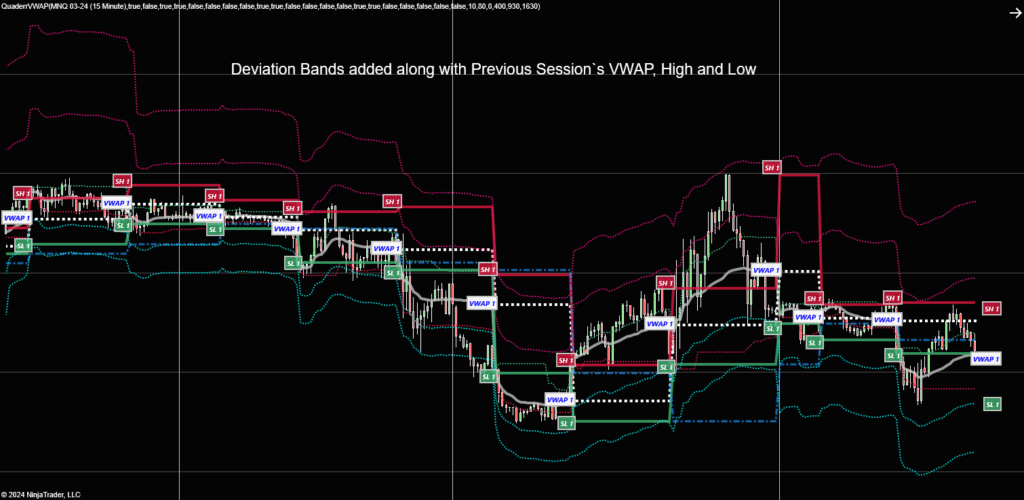
Displaying only the previous session`s VWAP, High and Low.
Please enjoy this indicator and feel free to share it ! Browse more free indicators here: https://quaderr.com/free-indicators/
Regards,
Quaderr Team
Nice touch, thanks for the free indicator! It is great you appreciate your customers! – Steve Curly